By Andrew Addison
My work turned bullish long-term on gold GC00 -0.78% almost two years ago when the precious metal closed above $1680 an ounce in November 2022. Its most recent cyclical advance began with its liftoff gap last October at $1845. Then, in March, gold said goodbye to 13 years of resistance in the $2100 area when it broke out decisively. And now with last week’s record close at $2610, gold is beginning to advance with “escape velocity,” which projects substantially higher prices.
Let’s check the charts to see why.
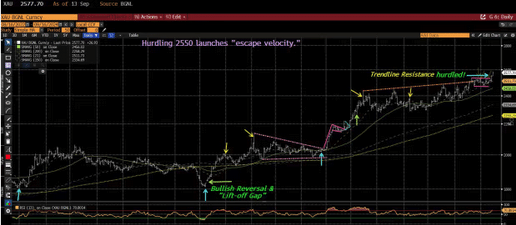
The daily chart (above) illustrates the resistance trendline that had repelled gold starting in April. Despite many false starts and bearish reversals (yellow arrows), gold consolidated for a month at resistance before breaking out last Thursday.
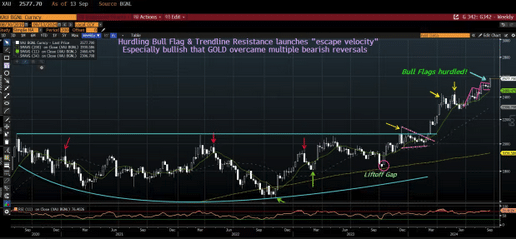
Next, the weekly chart (above) shows that after false starts (yellow arrow), gold formed two “bull flags” (pink). Quick advances were followed by sideways price action and sharp advances to new highs. With a decisive hurdling of final resistance, gold launched escape velocity.
On the monthly chart, you can see the gigantic 13-year base. From 2020 to 2023, gold formed a series of high-level consolidations. Each high-level consolidation was higher and shorter than the previous one—indicating weakening selling pressure on each probe to the top of the base.
With last month’s breakout, gold overcame final resistance to begin “escape velocity” that my work projects to $3000-plus. Consider all pullbacks as opportunities to buy or add to positions.
See full article HERE.