Sentiment readings currently don’t suggest a major top is near
Looking to 2025, I am reiterating my bullish call on gold — even, and over U.S. stocks.
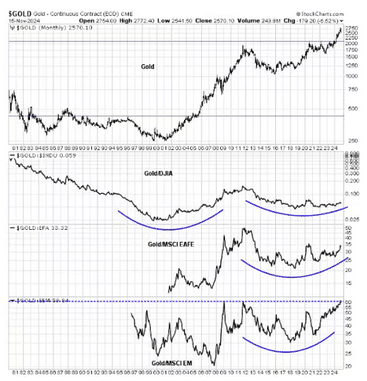
Going back to 1980, there have been several distinct gold bull-bear cycles. For example, gold topped out at 850 in early 1980 and began a bear market that bottomed in 1985. It traded sideways and made a second bottom in 1999 and then made new recovery highs in 2004 before topping out in 2011. It subsequently broke out again at 2,100 in early 2024 and the rally has continued.
Gold now is tracing out saucer-shaped multi-year bases against different regional stock indices. The gold/Dow ratio is the weakest owing to the strength of U.S. stocks, but it is nevertheless distinctive. The Gold/EAFE ratio is poised for a relative breakout, and the gold/emerging-markets ratio has marginally broken out of a 12-year base.
These technical patterns argue for a bullish commitment to gold for 2025 and beyond for all investors in all major currencies from an asset allocation perspective.

Favorable technical picture
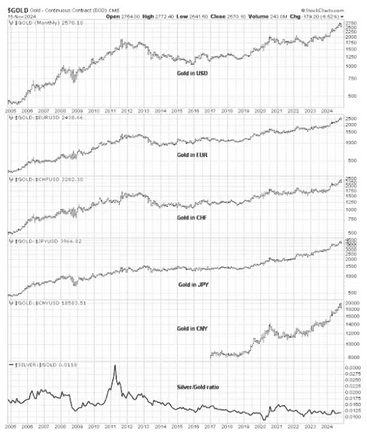
Here is another long-term technical reason to be bullish. Not only did gold prices stage upside breakouts in U.S. dollars but in all major currencies. The chart below shows gold’s long-term breakout to all-time highs in selected currencies, even the Swiss Franc which is considered to be a “hard” currency.

The bottom panel in the chart shows the silver/gold ratio as an indicator of speculation in precious metals. The last major gold peak was accompanied by a spike in this ratio, which is not in evidence today. Sentiment readings are not in place for a major gold top.
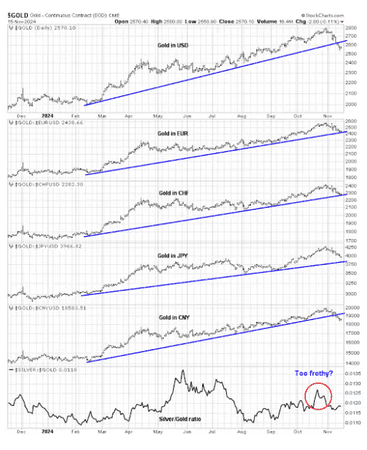
The chart below, meanwhile, is a close-up of the recent corrective action in gold. The violation of the rising trend line in USD is concerning, but gold did not violate the rising trend line in most other currencies. Arguably, the recent spike in the silver/gold ratio in October was a sign for traders that sentiment had become overly frothy and a pullback was due. Nevertheless, the overall technical structure of price action remains bullish.

The end of disinflation?
Gold is useful as a diversifier in a portfolio because it’s a hedge against unexpected inflation. Bloomberg columnist John Authers recently made the point that the latest October CPI report is showing signs that the disinflation trend is fading. Different measures of CPI are above the Fed’s 2% target and they may have stopped falling (see Inflation Needs Subtlety Right Now. It’s Getting Trump). In particular, Authers observed: “Both core services excluding shelter (the Fed’s so-called supercore, which has been given much emphasis over the last couple of years) and shelter ticked up very slightly and remain above 4%”.
Authers concluded: “Taken together, the data probably don’t justify another rate cut next month. However, the Fed has a dual mandate. The latest employment figures showed weakness, and so on balance the path of least resistance is to cut again, but only by 25 basis points. Further, there’s a general expectation in the market that another cut is coming, and it might be dangerous to disappoint those hopes when the post-election markets are already volatile.”
Yet U.S. Federal Reserve Chair Powell signaled in a recent speech that the Fed may not need to cut rates at the December FOMC meeting: “We are moving policy over time to a more neutral setting…we will carefully assess incoming data, the evolving outlook, and the balance of risks. The economy is not sending any signals that we need to be in a hurry to lower rates.” [Emphasis added]
All of these trends are in place even before U.S. President-elect Donald Trump takes office — and none of them are attributable to his policies. Trump’s plans to raise tariffs, extend tax cuts, and his stated intention of interfering with the Federal Reserve’s conduct of monetary policy is inflationary (see my analysis Revisiting the Trump Trade). Even as gold prices corrected, inflation expectations, as measured by the five-year breakeven rate, have been rising.
Waiting for a bottom
Tactically, I am waiting for the gold correction to bottom. Here is what I am watching. Jason Goepfert at SentimenTrader observes that gold typically hits bottom when it falls 2% below its 50 daily-moving-average, which just happened. Will history repeat?
Another way of spotting a possible corrective bottom is to monitor the technical conditions of gold mining stocks. VanEck Gold Miners ETF a proxy for this group, is in a clear corrective phase and looks oversold. The gold miner-to-gold ratio is near the bottom of its historical range, but readings are not at levels seen at recent bottoms. In addition, I would watch for percentage bullish to decline into, or at least near, the oversold zone before becoming turning tactically bullish.
Lastly, keep an eye on the U.S. Dollar Index . The dollar rallied in the wake of Trump’s victory to the top of a range, and technical conditions appear extended. If it were to be rejected at resistance, a decline would be a tailwind for gold prices as the two tend to be inversely correlated.
Overall, the picture is bright. Gold prices have staged multi-year breakouts in multiple currencies, indicating a long-term bullish outlook. In addition, gold is on the verge of staging relative breakouts against global equity markets that point to multi-year outperformance ahead. The macro outlook calls for a reacceleration of inflation, which is also positive for gold. Investors should be accumulating gold in anticipation of superior returns in the years ahead.
Read the full article HERE.


