Silver surged to a record high as soaring ETF inflows, rising industrial demand, expectations of a Fed rate cut, and a falling gold-silver ratio point to a continued rally toward $62 and potentially $100.
Silver (XAG) prices surged to a record high of $59.33 last week, driven by soaring ETF inflows, rising industrial demand, and expectations of a Fed rate cut. In my view, this shift in the macro backdrop sets the stage for a continued rally toward $62 and potentially $100 in the coming months. This article presents the key macro drivers, technical breakout patterns, and confirmation signals that support this bullish outlook.
Macro Forces Align to Fuel Silver’s Breakout in 2025
A mix of monetary, structural, and geopolitical forces drives silver’s surge in 2025. The metal hit a record high of $59.33 last week and is on pace for its second-best year ever. This momentum reflects deep shifts in both investor positioning and industrial supply dynamics.
ETF Inflows, Fed Policy, and Monetary Shifts Support the Rally
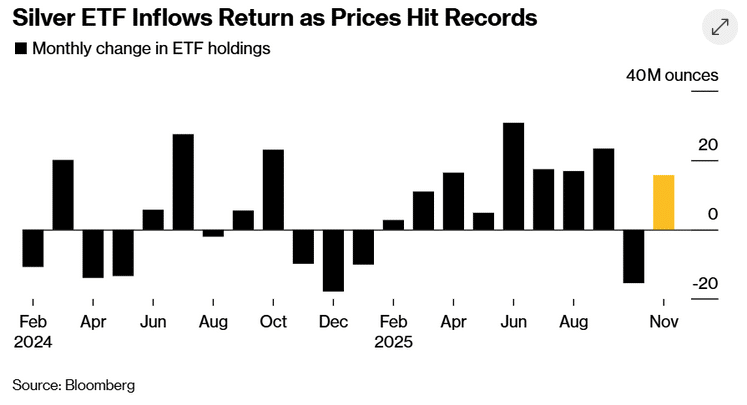
The silver rally is supported by capital flowing into silver‑backed ETFs. The chart below shows that investors added 15.7 million ounces in November, marking the largest monthly inflow since July. ETF demand has increased in 9 of the past 11 months, highlighting persistent institutional interest.
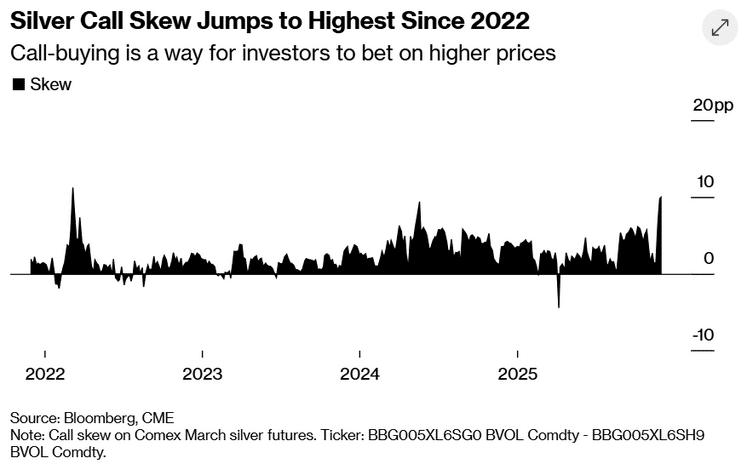
Moreover, call-option premiums have also surged. Silver skew jumped to its highest level since March 2022, indicating that bullish bets are becoming increasingly expensive. This surge in positioning signals growing conviction that silver’s breakout is more than just a speculative spike
On the other hand, rate cut expectations are also fuelling the silver surge. Markets are pricing in an 86% chance of a 25 basis point cut at the Fed’s December 10 meeting.
This follows weak U.S. jobs data and delayed economic releases after the recent government shutdown. Moreover, President Trump’s push for a dovish Fed chair further supports this backdrop.
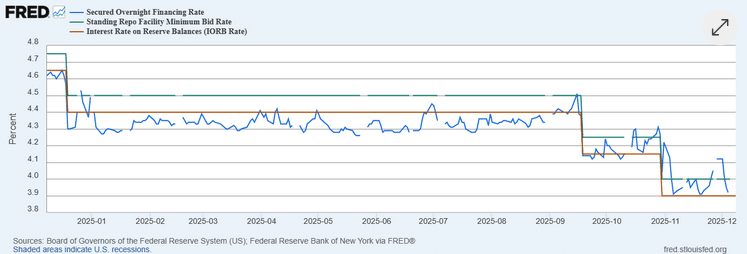
In November, the Secured Overnight Financing Rate (SOFR) briefly spiked to 4.10%. It increased above the Fed’s standing repo rate of 4.00%, signaling short-term funding stress. Although SOFR has since retreated to around 3.90%, the earlier dislocation added a layer of volatility. This volatility supported precious metals.
Supply Deficits and Geopolitical Risks Add Structural Tailwinds
Moreover, structural supply constraints are also driving prices. Despite a record flow of silver into London in October to alleviate shortages, inventories in that region increased. However, inventories in China’s Shanghai Futures Exchange have dropped to decade lows. Borrowing costs for physical silver remain high, underscoring tight market conditions.
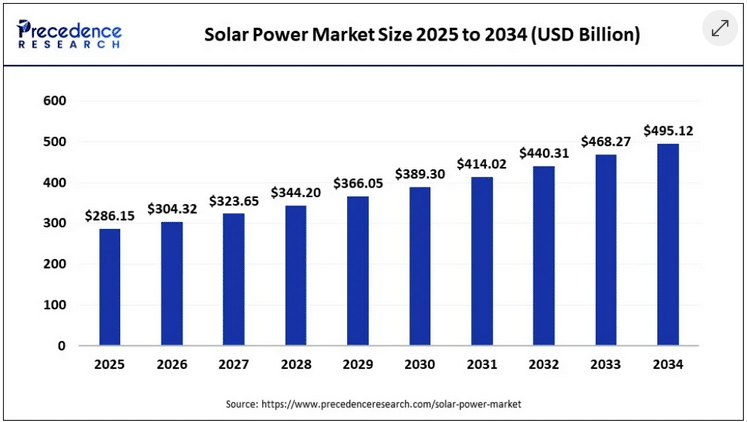
Furthermore, silver has been in a supply deficit for five consecutive years. Industrial demand from solar panels, EVs, and medical technology continues to outpace mine output. The chart below shows that the solar power market is projected to reach $495.12 billion by 2034. This projected growth in solar PV demand indicates a significant surge in silver demand.
The market is also responding to geopolitical shifts. After silver was added to the U.S. critical minerals list, traders began to fear possible export tariffs. This has created hesitancy among suppliers and added a geopolitical premium to prices. It suggests that silver’s rally is no longer solely driven by safe-haven flows. It reflects long-term scarcity, accelerating industrial demand, and a macro environment that continues to support higher inflation.
These macro forces collectively support a bullish outlook for silver into early 2026. ETF demand, dovish policy, and tightening physical markets are converging at a time when silver’s role as money and metal is more relevant than ever
Silver Technical Breakout Signals $100 Surge
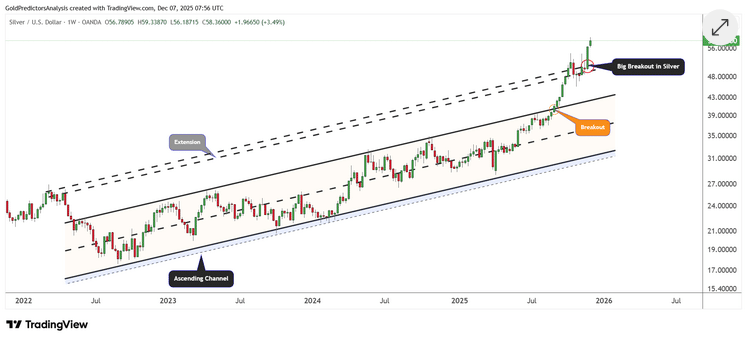
Despite strong macro support, silver’s price action also reinforces the bullish view. The metal has staged a powerful breakout from a two-year ascending channel, confirming a new leg higher.
After consolidating between $50 and $55 in late October, prices surged above the upper boundary of the long-term channel and are now extending beyond $58. Silver broke above the black dotted trendline on Friday, which marks the extension line of the ascending channel pattern. This breakout pushed the price to a new all-time high of $59.33 per ounce.
The weekly candles show strong momentum, limited pullbacks, and rising volume. The price remains well above all major moving averages, and the structure now targets the psychological $62 level next.
Moreover, the monthly chart for silver shows that the price is breaking a long-term resistance at $50-$55 pivotal zone. This breakout indicates a potential push in silver prices toward $100.
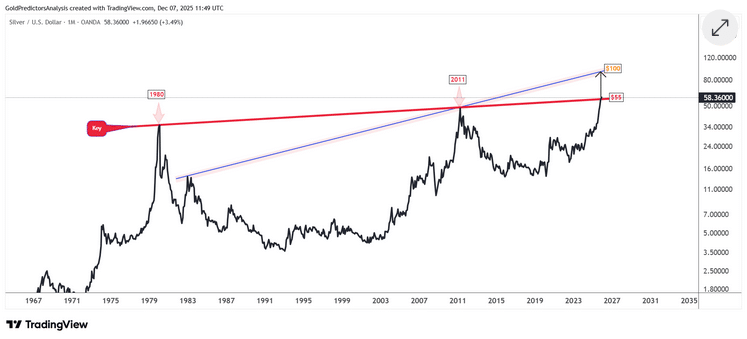
Based on these studies, momentum in the silver market is accelerating. Despite seasonal weakness, prices are producing new highs, indicating that a break above $59.33 could trigger a strong surge toward $62 in the short term. Moreover, a break above $62 will open the door towards the $100 level.
Read the full article HERE.