Key Points
- Gold hit a fresh high on amid investigations into Federal Reserve chair Jerome Powell.
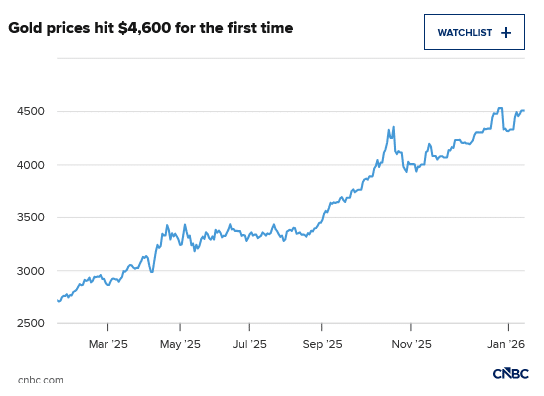
- Spot gold advanced 2% to hit over $4,600 an ounce for the first time on Monday.
- Latest flashpoints involving Iran and Venezuela also further catalyzed gold’s appeal as a safe haven.
Gold hit a fresh record high on Monday, extending a blistering rally as investors piled into havens amid a swirl of geopolitical and policy shocks in recent days.
Spot gold advanced 2% to hit over $4,600 an ounce for the first time, before paring gains slightly, data from LSEG showed. Prices have risen around 6% this year alone so far.
An investigation into Federal Reserve Chairman Jerome Powell and speculation over whether it could hasten a leadership change at the Fed has added a fresh layer of policy risk: “Especially if it results in him stepping down and then leaving the Fed earlier than scheduled and is replaced by someone more in favor of rate cuts,” said Morningstar equity analyst Jon Mills.
Federal prosecutors are examining a $2.5 billion renovation of the Fed’s Washington headquarters and Powell’s testimony to Congress, Powell said Sunday night. The Fed Chair added that the investigation stems from President Donald Trump’s long-running frustration with the Fed’s reluctance to cut interest rates as aggressively or as quickly as he has urged.
The scenario that the appointment of a new Fed Chair may pave the way for faster interest-rate cuts, is traditionally supportive for gold. Lower interest rates tend to lift gold by reducing the opportunity cost of holding a metal that pays no yield. That effect has been amplified by recent U.S. economic data that pointed to a cooling labor market.
Latest flashpoints involving Iran and Venezuela also further catalyzed gold’s appeal as a safe haven.
Tensions with Iran have resurfaced after Washington signaled it is weighing options to respond to unrest in the country. The U.S. also launched a military operation in Venezuela at the start of the year that saw the capture of the country’s president Nicolas Maduro last weekend.
“They all add to the narrative of heightened geopolitical uncertainty that led us to pick gold as one of highest conviction asset classes this year,” said Rajat Bhattacharya, senior investment strategist at Standard Chartered.
While the U.S. action in Venezuela has appeared to reach a relatively swift resolution, the episode still highlights the persistence of geopolitical uncertainty and the risk of flare-ups across multiple regions, Bank of Singapore’s Eli Lee similarly echoed.
In such an environment, Lee expects gold prices to see further support amid an ongoing backdrop of geopolitical unpredictability. Beyond geopolitics, the structural case for gold remains intact, the bank added, as investors reassess portfolio allocations following years of sanctions, geopolitical fragmentation and fiscal-monetary complexity.
HSBC said trading momentum could carry prices to $5,000 an ounce in the first half of 2026, even as volatility remains elevated and pullbacks may become more frequent.
The London-headquartered bank attributed the rally to a combination of safe-haven demand, a weaker U.S. dollar and policy uncertainty, noting that its FX strategists expect the greenback to remain soft in 2026.
“Mounting fiscal deficits in the U.S. and other nations are encouraging gold demand and may be a key factor going forward,” the bank said.
Central banks are also expected to remain strong buyers this year as they diversify away from the dollar, although HSBC cautioned that purchases may fall below the peaks seen between 2022 and 2024 due to high prices.
Gold prices saw a nearly 65% yearly gain in 2025, the highest in decades.
Read the full article HERE.
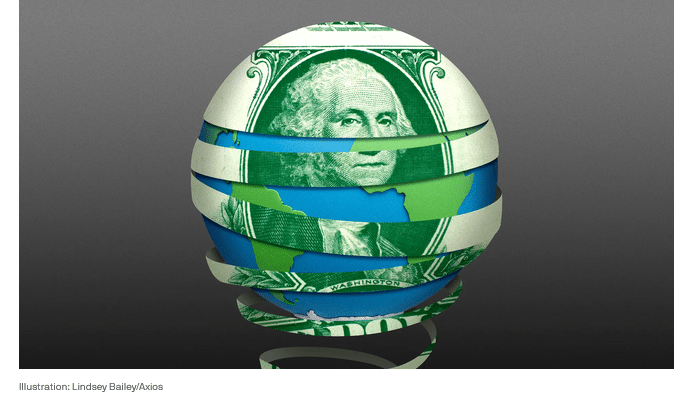
The status of the U.S. dollar as the global reserve currency is increasingly at risk, as central banks and investors continue to see America prioritizing its own interests, most recently in Venezuela.
Why it matters: It’s an advantage to have the world’s central banks keep their investments in your currency. Losing that would have broad implications for markets and the economy.
What they’re saying: With the U.S. “very much doing whatever it wants…I think there’s going to be a real push this year to for people to bring capital home,” Jay Pelosky, founder of TPW Advisory, tells Axios.
- “In this environment, the U.S. is becoming less attractive,” he adds.
- The seizure of Nicolás Maduro is the latest example of the America First focus of the Trump administration, a departure from the globalization that supported the dollar as the global reserve currency to begin with.
Catch up quick: Central banks are diversifying their holdings away from the dollar, in a move known as de-dollarization, which is also buoying alternative assets like gold.
- The dollar has been the go-to currency because of the dominance of the U.S. economy, the liquidity of its markets and trust in its institutions.
Threat level: Several factors have chipped away at that trust.
- The U.S. froze large portions of the central bank reserves in Russia after it invaded Ukraine and has increasingly used the dollar as a sanctions tool.
- Prolonged political and fiscal uncertainties, including tariff policy and debt-ceiling brinkmanship, raise questions about policy predictability.
- In response, central banks around the world have gradually diversified and shifted some of their reserves into gold and other currencies.
- The U.S. dollar share of global foreign exchange reserves slipped to multidecade lows in 2025, with the dollar falling nearly 9%.
Reality check: The tech rally may have the opposite effect, luring investors who want access to American AI goodness to the states, according to Steve Englander, global head of G10 FX research at Standard Chartered.
- Those inflows into American equities would likely be dollar-positive, since foreign investors typically need to buy dollars to purchase U.S. stocks, often without hedging against currency moves, increasing demand for the dollar.
- Englander says it is too soon to tell whether the capture of Maduro is dollar positive or negative. If the world is further broken into trading blocks, it could be a headwind, but if new leadership in Venezuela is cooperative, that could lift the dollar.
The big picture: There are several important advantages to the U.S. maintaining its global reserve currency status.
- It lowers borrowing costs to run fiscal deficits and spending surpluses.
- It is a source of geopolitical power, enabling the U.S. to exert dominance over countries far from our shores without firing a shot.
- It helps American businesses, which can borrow and trade in their home currency with less risk of losing money due to fluctuations.
The bottom line: Economist Kenneth Rogoff emailed me to say Venezuela is “a clear win for the dollar’s reserve currency status, but Trump has so many balls in the air, it is hard to know how important this will prove compared to say, undermining the rule of law and Fed independence (on the minus side) and advancing U.S. leadership in AI (on the plus side).”
- Nobody knows how this will play out. But the outcome is critical for the U.S. if it wants to continue enjoying its reserve currency status.
- facebook (opens in new window)
- twitter (opens in new window)
- linkedin (opens in new window)
- email (opens in new window)
Read the full article HERE.
- Treasury Secretary Scott Bessent pressed the administration’s desire for lower interest rates, saying they are the key to future economic growth.
- “Cutting interest rates will have a tangible impact on the lives of every Minnesotan,” he said, according to excerpts from a speech he will deliver later Thursday obtained by CNBC.
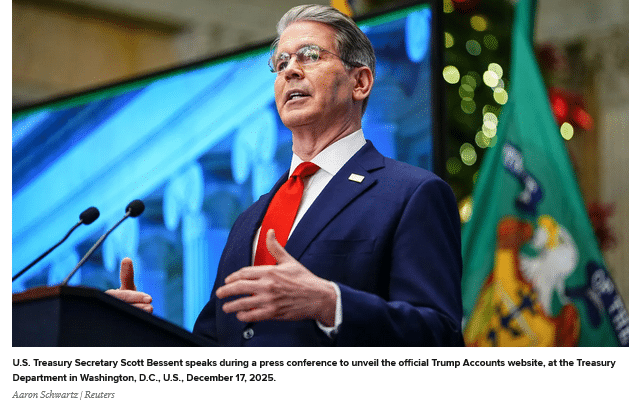
Treasury Secretary Scott Bessent on Thursday pressed the administration’s desire for lower interest rates, saying they are the key to future economic growth.
In a speech he will deliver before the Economic Club of Minnesota, Bessent backed President Donald Trump’s economic agenda and said easier monetary policy will help pave the way for gains ahead.
“Cutting interest rates will have a tangible impact on the lives of every Minnesotan,” he said, according to excerpts obtained from a source in the administration. “It is the only ingredient missing for even stronger economic growth. Which is why the Fed should not delay.”
The Federal Reserve approved three consecutive interest rate cuts in the final four months of 2025, totaling 0.75 percentage point and taking the central bank’s key interest rate down to a range of 3.5%-3.75%.
However, the pace of reductions is expected to slow considerably this year, with markets pricing in just two cuts and the most recent projections from Fed officials pointing to just one.
One wild card in that equation is that the Fed will get a new chair this year, a process that Bessent is overseeing. Current Chair Jerome Powell’s term ends in May, and the Treasury secretary has whittled down the candidates to five. National Economic Council leader Scott Bessent and former Fed Governor Kevin Warsh are the two betting favorites to get the position.
While lower interest rates carry the threat of reigniting inflation, they also could help support a slowing labor market.
“In 2025, the President laid the foundation for robust economic growth with: the historic passage of the One Big Beautiful Bill, trade deals that rewrote decades of global misalignment; and an ambitious deregulation agenda that empowered American entrepreneurs and businesses,” Bessent said. “Now, in 2026, we will reap the rewards of President Trump’s America First agenda.”
Bessent will deliver the speech at 12:45 p.m. ET.
Read the full article HERE.
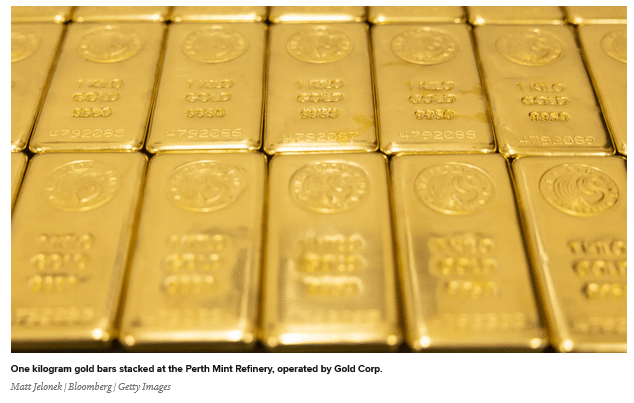
Gold is neck and neck with Treasuries to become the biggest reserve asset for foreign governments, driven by a year of explosive price gains and aggressive central bank buying.
Official holdings of gold abroad total more than 900 million troy ounces, according to data posted by World Gold Council this month. The numbers, sourced from the International Monetary Fund, refer to the end of November for most countries, though some figures are as of October.
Based on gold’s value on Nov. 30, that translates to $3.82 trillion worth of gold. That compares with the almost $3.88 trillion worth of long-and short-term Treasuries foreign governments held as of October.
“Nobody trusts anyone’s fiat currency, hence the rise in the appeal of gold and other metals,” wrote Joe Kalish, chief macro strategist at NDR in a research note on Monday. Other countries’ reserves of gold are on course to exceed the value of their Treasury holdings, according to Kalish.
“When I first started talking about this 3 months ago, the difference was pretty stark,” he wrote to Barron’s. “Today, not so much based on estimates and current pricing.”
Using year-end prices and assuming foreign central bankers haven’t reduced their stocks of gold, foreign central banks ended 2025 holding an estimated $3.93 trillion worth of gold in their reserves. That puts gold reserves ahead of holdings of Treasuries.
That gold appears to have taken the crown makes sense, considering that the price of gold rose by 66% last year.
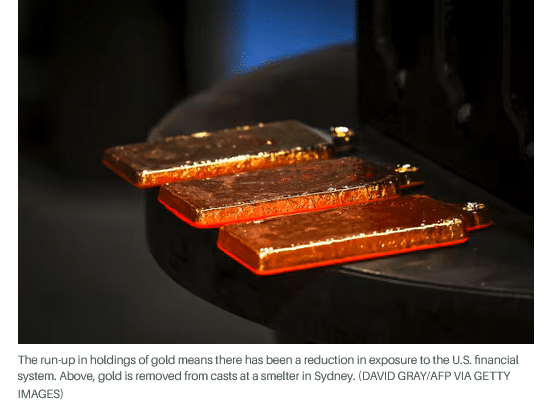
Still, the run-up in gold’s position means there has been a reduction in exposure to the U.S. financial system, be it due to the decline in the value of the dollar or to escape the risk that assets could be seized or sanctioned by the Donald Trump administration.
Gold has an appeal as a haven asset, as this week’s moves in the price illustrate. The front-month futures contract on Comex rose 1% on Tuesday, following a 2.8% gain on Monday, in response to the uncertainty created by the U.S.’s seizure of Venezuela’s president on Saturday.
The boost may be short-lived, says Michael Bradshaw, head of precious metals at Allspring, a global investment firm. Such events “are a reason to own gold but not necessarily a reason to buy gold today,” he said.
Gold’s long-term trajectory depends on a variety of factors, including U.S. monetary and fiscal policy. Lower interest rates make gold more attractive, as does higher inflation. The relative strength of the U.S. dollar, and whether central-bank buying continues are other factors to watch.
Much of Wall Street is bullish on gold, including UBS, which just reverted to an “overweight” call on gold. Capital Economics has taken the other end of the stick, predicting gold will decline in 2026.
The “latest break-neck rally in prices has been driven largely by western retail investment demand, which could dissipate quickly,” the firm said. Especially “if our view that the Fed cuts rates by less than is discounted in the market proves accurate.”
Read the full article HERE.
Key Points:
- Gold futures increased 0.5% to $4,471 per ounce, following a nearly 3% jump on Monday, marking its best two-day rise since mid-October.
- Silver prices climbed 1.9% to $78.10 per ounce, extending gains after an 8% increase in the previous trading session.
- Geopolitical events, including U.S. actions in Venezuela and comments on Mexico and Cuba, are driving investors to safe-haven assets.
Gold and silver prices rose again early Tuesday as investors continued to buy up haven assets. President Donald Trump’s recent ouster of his Venezuelan counterpart Nicolás Maduro has added new risks to financial markets that are likely to persist–pointing toward more gains for precious metals.
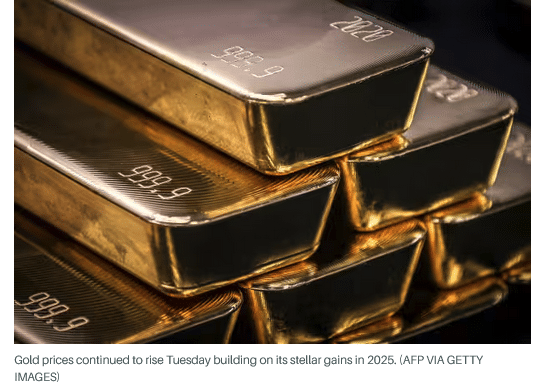
Gold futures rose 0.6% to $4,475 per ounce, after jumping close to 3% Monday. It’s bullion’s best two-day rise since the middle of October. SilverSI00+4.56% also extended its recent gains, climbing 2.3% to $78.44 per ounce after an 8% move in the previous session.
“Geopolitical events bring upside risks to precious metals,” Morgan Stanley strategist Amy Gower said in a note Monday, reiterating her positive outlook on metals in 2026.
Trump’s pledge to “run” Venezuela, home to the world’s largest proven oil reserves, stoked energy market volatility over the weekend and raised the prospect of further U.S. interventions in other parts of the world.
Trump also told Fox News on Saturday that “American dominance in the Western Hemisphere will never be questioned again,” adding that “something will have to be done about Mexico”. The Trump administration also made comments about Cuba.
“It is difficult to trade geopolitics. However, some investment themes should benefit over the coming days,” Jefferies strategist Mohit Kumar said in a note Tuesday. “Diversification away from the U.S. dollar should gain further ground and gold should be the main beneficiary,” Kumar added.
Precious metals enjoyed a blistering rally in 2025, with gold rising 65% and silver surging more than 140%. This year may not quite match those gains but the geopolitical setup looks favorable for the rally to continue for now.
Read the full article HERE.
- Gold and silver advanced as investors weighed heightened geopolitical risks following the US capture of Venezuelan leader Nicolás Maduro.
- The US plans to “run” Venezuela after ousting Maduro, leaving the future governance of the South American nation uncertain, according to President Donald Trump.
- Gold often rallies in the short term as geopolitical tensions spike, although the effect is often short-lived, and some analysts believe the impact of the Venezuelan event on gold prices will be limited over time.
Gold and silver advanced, with investors weighing heightened geopolitical risks following the US capture of Venezuelan leader Nicolás Maduro.
Spot gold rose as much as 2.5% on Monday, climbing above $4,430 an ounce, while silver gained almost 5%. President Donald Trump said the US plans to “run” Venezuela after ousting Maduro over the weekend, leaving the future governance of the South American nation uncertain. He said Washington required “total access” to the country, including its oil reserves.
The episode “reinforced a backdrop of geopolitical uncertainty,” said Christopher Wong, an analyst at Oversea-Chinese Banking Corp. in Singapore. However, immediate risks are limited as “developments in Venezuela point to a relatively quick closure, rather than a prolonged military conflict,” he added.
Gold often rallies in the short term as geopolitical tensions spike, although the effect is often short-lived.
An analysis of the long term impact of geopolitical events “shows a far more limited price impact in time on gold prices than, for instance, oil,” Bernard Dahdah, an analyst at Natixis, said in a note. “Our view is that if there are no further repercussions or a domino effect in the capturing of Maduro, then this event will cease to have an impact on the price of gold.”
In addition to events in Venezuela, Trump also used the weekend to restate his ambitions for Greenland, part of NATO-ally Denmark’s territory.
Trump told reporters in Washington that “Greenland is covered with Russian and Chinese ships all over the place. We need Greenland, from the standpoint of national security, and Denmark is not going to be able to do it, I can tell you.”
Denmark’s prime minister denounced the notion, saying the US “has no right to annex” any of its territory.
Gold is fresh from posting its best annual performance since 1979, hitting a series of records throughout last year with support from central-bank buying and inflows to bullion-backed exchange-traded funds. Three successive rate cuts by the US Federal Reserve were also a tailwind for precious metals, which don’t pay interest.
Some leading banks forecast further gains in gold this year, especially with the Fed expected to deliver additional interest-rate reductions and Trump reshaping the US central bank’s leadership. Goldman Sachs Group Inc. said last month that its base case was for a rally to $4,900 an ounce, with risks to the upside.
Adding further support, the US economy is facing long-term risks posed by mounting federal debt, according to a panel of economic luminaries speaking Sunday. Former Treasury Secretary Janet Yellen said preconditions are strengthening for fiscal dominance, whereby the size of debt prompts the central bank to keep rates low to minimize servicing costs.
Silver rallied even more than gold last year, blowing through levels that until recently seemed unthinkable to all but the most enthusiastic of market watchers. In addition to the factors that aided gold, the white metal has also benefited from sustained concerns that the US administration could eventually impose import tariffs on the refined metal.
The fear of tariffs have drawn much of the world’s readily available silver to the US, leaving other markets substantially tighter. Silver contracts on the Shanghai Gold Exchange traded more than $5 an ounce above spot prices in London on Monday, while the London prices continued to trade at a premium to futures on the Comex exchange in New York. That’s an unusual reversal of what is normally a discount.
Gold rose 1.7% to $4,407.02 an ounce as of 12:40 p.m. in London. Silver climbed 2.7% to $74.75. Platinum and palladium also advanced. The Bloomberg Dollar Spot Index, a key gauge of the US currency’s strength, was up 0.2%.
Read the full article HERE.
Investors appear to be hedging a policy shift the central bank hasn’t acknowledged.
Key Points
- Gold’s 70% surge is biggest since 1979.
- A tough Fed then stamped out inflation, and gold’s rally.
- For 2026, gold investors are pricing a different scenario.
You know something big is happening in the world when the price of gold is not only at record highs but is also on track to have its best yearly gains in 46 years.
As 2025 draws to a close, gold broke through the $4,500 mark for the first time, and despite some pullback from a 70% surge, the precious metal is still headed for a roughly 65% annual gain.
This is the strongest yearly advance for bullion since 1979. That year, the Iranian Revolution caused a spike in oil prices, and the Soviet Union invaded Afghanistan.
Back then, demand for gold, which investors turn to as a safe haven asset and a hedge against inflation, catapulted prices from $200 an ounce in 1978 to $850 an ounce in January 1980.
Recently, with the yellow metal having scored its best gains since that period, many market commentators have drawn parallels between the late 1970s and the present day.
On the one hand, an uncertain geopolitical backdrop — Iran and Afghanistan in the past; Ukraine, the Middle East, and Venezuela today — is boosting safe haven demand.
On the other hand, there is a weakening dollar.
Just as in the late 1970s, the greenback has sharply weakened. This makes dollar-denominated gold more attractive to holders of other currencies. Through the first half of 2025, the dollar (DXY) was down 10.6% against major currencies. That is its worst first-half performance since 1973. The greenback is expected to end 2025 about 9.5% lower.
But, and that’s reassuring for gold investors, what then happened in 1980 is very unlikely to happen in 2026.
A tough Fed stamped out inflation, and gold
Between 1980 and 1982, the Federal Reserve, led by its legendary Chairman Paul Volcker, used monetary tools to lift short-term interest rates to a historic high of 20%, effectively stamping out inflation — and U.S. economic growth.
Higher interest rates made U.S. Treasuries and assets very attractive. The dollar strengthened dramatically, and gold slumped back to about $300-$400 an ounce by 1982.
Volcker had been brought in to reverse nearly a decade of undisciplined U.S. monetary policy. This policy had seen inflation surge close to 8%, even before the 1979 oil shock.
Today, according to many market and economic observers, the Fed appears likely to do the opposite of what it did after 1979, signaling a potential policy contrast for 2026.
Sticky inflation, weak jobs and rate cuts
While inflation is not as high as it was in the late 1970s, it has proven ‘sticky,’ recently approaching 3% in early 2025 and remaining above the central bank’s 2% target, yet the Fed is shifting policy differently than it did in 1980.
Prompted by signs of a weak labor market, the Fed has cut short-term rates three times since September. Rates now range between 3.5% and 3.75%, the lowest level since 2022.
After the last move in December, Fed Chair Jerome Powell noted that the current rate is within the estimated neutral range, while the central bank will continue to observe economic developments.
Yet, according to Fed funds futures, the market still expects at least two quarter-point rate cuts next year.
These expectations partly reflect worries about the U.S. economy, which could justify further rate cuts.
Fed independence in Trump’s crosshairs
However, many observers have also noted that the Trump administration has made it clear it wants the next Fed chairman, due to replace Powell in May, to push aggressively for lower interest rates, regardless of the circumstances.
“There is no Volker-like figure in the offing,” notes Bart Melek, Global Head of Commodity Markets Strategy at TD Securities. “Instead, the [Fed] may be filled with relative doves come May 2026, who see the two percent inflation as a suggestion and not a hard target which must be reached at any cost.”
Expectations that the central bank’s independence may become compromised in May have already led to market distortions. Long-term interest rates have stayed higher than expected, even after the Fed began cutting rates in September.
“There’s nothing happening with rates going up out there that suggests concern about inflation in the long-term, or anything like that,” noted Chair Powell recently. “So why are rates going up? It has to be something else.”
Premium in bonds and in gold
BBVA Research and other analysts say long-term rates currently embed a ‘premium.’ This is due to uncertainty as the announcement of Powell’s successor approaches early next year.
Even perceived interference by the government in Fed policy-making could lead to higher long-term borrowing costs, BBVA says. This would defeat the Trump administration’s efforts to lower them.
In normal times, U.S. Treasuries are regarded as one of the safest and most reliable income-producing assets. Higher long-term Treasury yields directly compete with gold as an investment option.
But these are not normal times: According to analysts at the CPM Group, “reduced faith in the U.S. central bank’s independence already is and would continue to be very supportive of gold and silver investment demand.”
Annual gold returns then and now:
- 2025: 65.4%
- 2024: 27.2%
- 2023: 13.1%
- 2022: -0.23%
- 1981: -32.2%
Eric Winograd, chief U.S. economist at Alliance Bernstein, says higher inflation has often followed when central banks bend to political influence. He cites the 1970s, when the Fed followed President Nixon’s lead and cut rates. This sparked inflation that stuck throughout the rest of the decade.
If a similar scenario were to emerge in 2026, the dollar would lose some of its purchasing power and continue to slide, as investors would seek alternative assets.
“While assets like gold and cryptocurrencies are somewhat speculative, we think they would benefit if the Fed’s independence were threatened,” Winograd says. “Both are dollar alternatives and perceived to be effective inflation hedges.”
It remains to be seen which way the winds will blow for the U.S. economy and for the Fed in 2026. But one thing is for sure for gold investors: The economic and policy parallels are closer to those of the early 1970s than of 1979.
Read the full article HERE.
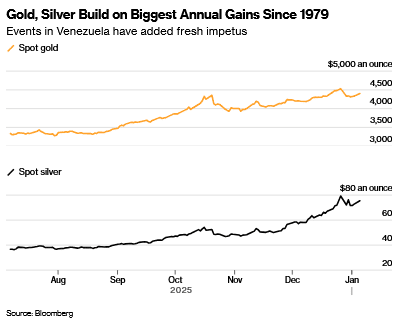
Despite year-end drops for gold and silver, both are still on pace for their biggest yearly percentage gains since 1979
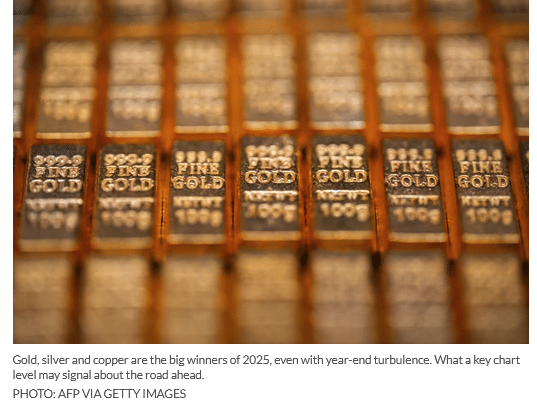
Year-end turbulence was only modestly slowing the surge in silver, gold and copper in 2025, with the metals providing important ballast to portfolios as President Donald Trump’s tariffs rattled markets and a spending frenzy around artificial intelligence entered a new debt-funded chapter.
For the year, gold was up nearly 65% and silver was about 145% higher as of Wednesday, putting both on pace for their biggest annual percentage gains since 1979, according to Dow Jones Market Data based on the most-active metals contracts.
Copper’s roughly 40% jump this year, while slightly more modest, would still mark its largest yearly increase since 2009 and amount to more than double the S&P 500 index’s 17% gain so far this year.
The clamor around metals has stirred debate about potential bubbles forming in gold and silver that could end badly for investors, especially those arriving late to the party. Yet on the last trading day of 2025, all three metals were perched above their 50-day moving averages, a key technical level that can be a bullish signal for an asset’s price.
“Big picture, it means there’s a lot more buyers than sellers,” Sameer Samana, head of global equities and real assets at the Wells Fargo Investment Institute, said of the uptrend. “That has to do with the dollar weakness in the early part of 2025, plus, you could argue, a lot of uncertainty around how countries will manage their fiscal health going forward.”
The ICE U.S. dollar index a measure of the buck against a basket of rival currencies, booked its worst first half of the year since 1973, when Richard Nixon was president. It since has recouped some of its 2025 losses but was still 9.4% lower on the year through Wednesday, according to FactSet.
A turbo rally in silver
Unlike gold and silver, copper isn’t considered one of the world’s precious metals. Yet like silver, it was added to the U.S. Interior Department’s list of critical minerals this year, given its role in wiring, power generation and electrical transmissions, all which are essential to the AI buildout.
Recent bullishness helped silver gain more than 55% in the past three months alone, while copper shot up nearly 17%, gold rose 12.5% and the S&P 500 added 0.2% over the same span, according to FactSet data.
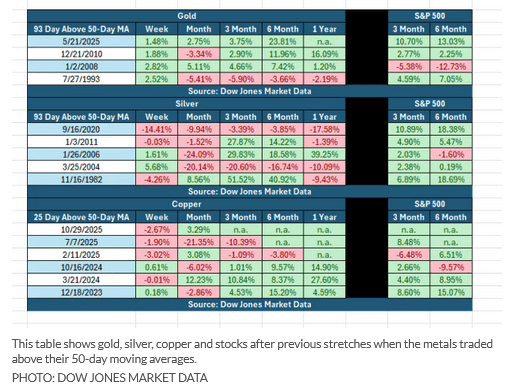
From a technical perspective, the most recent leg of the metals rally has pushed gold and silver above their 50-day moving averages for a relatively long 93 trading days through Wednesday, while copper was above that threshold for 25 trading days, according to Dow Jones Market Data based on most-active futures contracts.
That has happened only four other times for gold since 1993 and five other times for silver since 1982, according to Dow Jones Market Data. Shorter stretches of at least 25 days for copper have been fairly common in recent years.
While the past doesn’t predict the future, similarly long trading stretches above the 50-day moving average have tended to skew bullish for stocks and gold in the weeks and months that follow, while silver has been mixed and copper has seen most of its gains after the three-month mark.
Importantly, gold showed its resilience this year after equities sold off in April following Trump’s “liberation day” tariff announcement, which shocked investors and triggered an ugly reaction in the bond market.
“Fixed income sort of helped, but crypto also fell by the wayside, while gold held up,” Samana at Wells Fargo said. “Given the nature of the beast, you look at your last best hedge when markets sell off, and I think it’s fair to say that’s gold.”
Skepticism around inflation and whether it can be tamed next year, especially with tax breaks and the data-center boom likely to reaccelerate the economy, would likely work in favor of metals in 2026, Samana said.
Spending on AI infrastructure is also not expected to let up in the years ahead. The U.S. already has nearly 3,750 data centers, according to the Data Center Map, an industry research tool launched in 2007.
For every new data center, metals have a role in the process. “There’s copper for wiring and silver in a lot of chips,” Samana said. And at least globally, demands for power from data centers will mean harnessing alternative-energy sources, where silver has been playing a major role.
Read the full article HERE.
Key Points:
- Platinum is rallying toward $3,000 after confirming a long-term breakout in December 2025.
- The platinum-to-gold ratio has broken out of a 15-year downtrend, suggesting platinum is poised to lead the metals complex in 2026.
- Structural deficits, strong investment flows from China, and growing demand for green hydrogen are converging to support a bullish super-cycle in platinum.
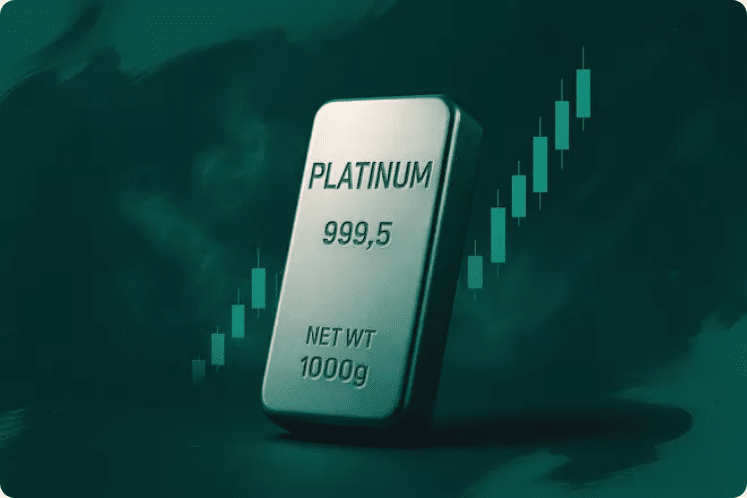
Platinum (XPL) prices have broken above the key level of $2,300, as years of hidden supply stress are now showing up in price action. At the same time, platinum’s demand base is growing due to stricter emissions standards and increased use of clean energy. In my view, this convergence indicates that platinum will be one of the most important metals in the next phase of the commodities cycle. This article presents macro drivers, technical confirmation, and related market signals that support the case for a continued surge in platinum prices.
Macro Drivers—Platinum Deficits and Investment Demand
Aboveground Stocks Collapse Triggers Price Breakout
Platinum was structurally short for the last three years. However, the prices broke record levels in 2025. The earlier deficits failed to spark a strong rally because there were still plenty of stocks above ground to feed the difference. That case is no longer valid as inventories are falling while supply lags demand. In 2025, the stocks had fallen to low levels. This fundamental change favours the bullish price trend for platinum.
On the other hand, investment demand is supporting the platinum prices in 2025. The US was displaced by China in 2025 as the largest investor market for platinum. The physical purchases of platinum have surged. In addition, strong market momentum and positive price action drove positive ETF flows.
According to the WPIC Q3 2025 report, there has been a dramatic change in the market dynamics. The data below shows that the overall demand for platinum increased by 28% YoY to 1,982 koz in Q3 2025. However, this growth covers up weaknesses in key industrial areas. Jewellery demand dropped 29% QoQ, while automotive demand declined 2% YoY and 8% QoQ. Moreover, the industrial use dropped 8% YoY, with the glass-related use declining by 30%.
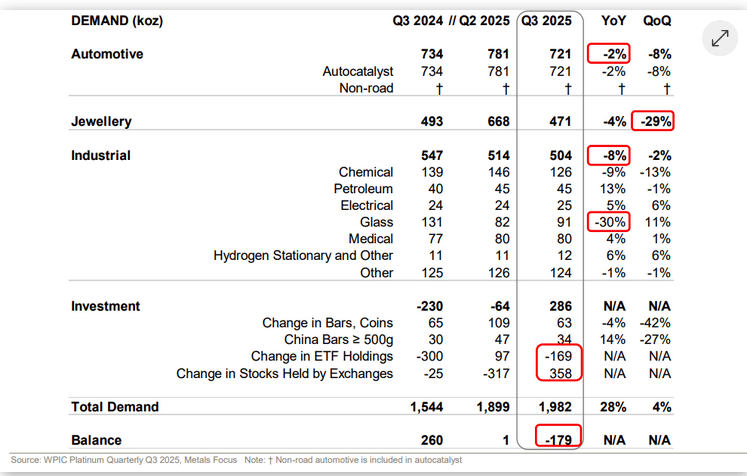
Despite the weakness in the industrial and jewellery demand, the total investment demand bounced back dramatically from -64 koz in Q2 to +286 koz in Q3. This demand is due to new ETF purchases and heavy Chinese retail buying. Since the industrial demand is weak, investors are now driving platinum’s upside to sustain the rally.
Auto Sector Holds While Clean Energy Expands
The largest user of platinum is from the motor vehicle industry, which has been aided by the tightening of emission control laws in major markets. The engines require improved loadings of PGM. In the meantime, the rhythm of electrification is slower than its expectations as a consequence of the deficiency of even distribution of consumer uptake and weaker policy backing.
Consequently, combined platinum and palladium (XPD) demand will be broadly stable until 2030, according to WPIC. Platinum is also more flexible than palladium, as auto makers have used platinum in the past instead of palladium when the palladium price goes high. However, the current price trends and the supply chain risks limit the forceful short-term changes.
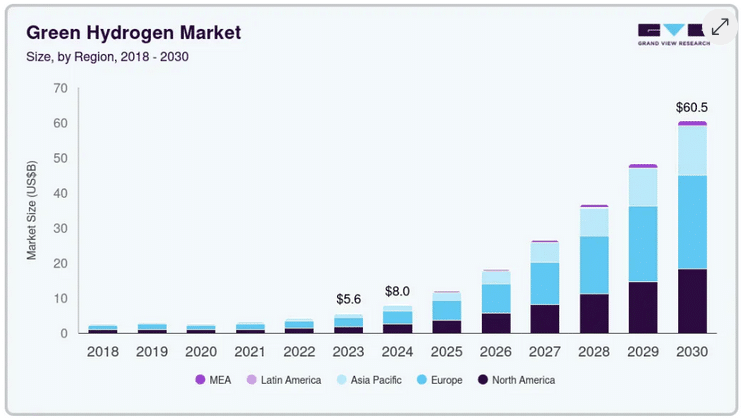
Platinum also benefits from new energy technologies that allow it to have valuable long-duration optionality. Platinum catalysts are critical to the production of green hydrogen and fuels. This importance aligns more with long-term decarbonization plans than with short-term cycles in vehicle demand. The chart below shows that the market size for green hydrogen will grow exponentially during the next few years.
Due to stabilised catalytic demand and strong emerging clean energy applications, platinum has numerous avenues of demand. All these factors narrow the risks of downside and strengthen its long-term macro position.
Platinum Technical Analysis – Phase 3 Super-Cycle Targets $3,000+
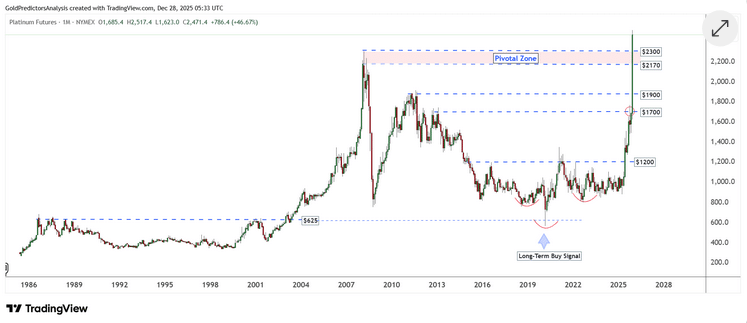
Platinum has confirmed a long-term breakout, which has started a new parabolic phase. According to the monthly chart, the price increased by more than 46% in December 2025 and became the first month to close above the historical level of $2,300. This breakout wraps up the consolidation, which started following the high of 2008 and validates the market in Phase 3 in the super-cycle.
Historically, platinum has traded in three-phase rallies. The first phase was formed in the late 1970s. The second phase shot the prices into 2008. The third phase is currently underway. This surge is supported by the significant breakout from the long-term cup and handle patterns and indicates further upside.

The chart below shows that the price has clearly broken out of the major resistance range of $1,700. This breakout triggered a bullish measured movement to aim at $2,300. However, the price shot more than $2300, which means that Platinum is on a parabolic trend. This parabolic trend was triggered in silver when the silver price broke the historic $50 ceiling.
The breakout from $2,300 indicates the immediate target of $3,000. However, depending on the current price action, platinum can continue to surge above $3,000 in 2026.
The major resistance of $2,300 has now become the support level. A successful retest of this level would open the door to a sustained increase in platinum prices.
The price action is supported by tight physical supply, backwardation on forward markets and ETF accumulation. The performance of platinum has been superior to that of palladium and has been leading the pack among the industrial metals. Therefore, the technical structure points to even higher levels in 2026.
Cross-Metal Signals from Gold, Silver, and the US Dollar
US Dollar Roll-Over Signals Strong Tailwind for Platinum
The chart below shows the correlation between the long-term trend in the US dollar index and platinum. The data shows significant inflection points in 1985, 2002 and 2022 that marked peaks in the US dollar index.
These peaks coincide with significant platinum bottoms. Platinum entered a major uptrend after every dollar peak. The recent platinum breakout is technically sound and macro supported, as evidenced by this cyclical correlation.
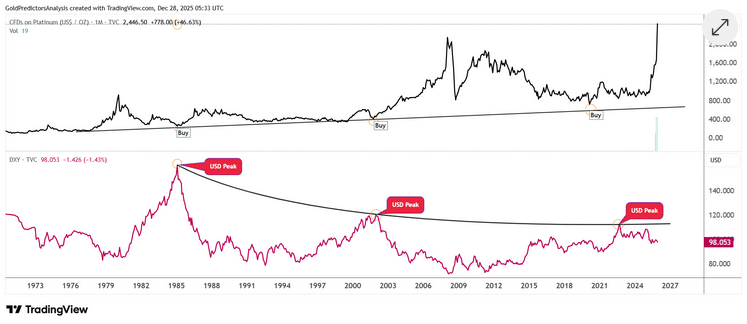
The platinum market shot up in 2025 when the dollar rolled over its long-term resistance. The movement of the prices validates a long-term breakout of the trendline support. Platinum has passed into a new bullish cycle as the dollar moves out of its cyclical high. The thesis is supported by the past three technically supported US dollar peaks. Moreover, the sharp increase in the prices of gold (XAU), silver (XAG), and platinum above historical levels indicates that the US dollar will likely drop in the next few weeks.
Platinum-to-Gold Ratio Breakout Signals Leadership Rotation
The platinum/gold ratio has come out of a 15-year downward trend channel. This is a significant change in market structure. Since 2008, resistance trapped the ratio, and every attempt to break the channel failed. However, the latest action above 0.50 proves a definite breakout. This breakout indicates that platinum may perform better than gold in the next cycle.
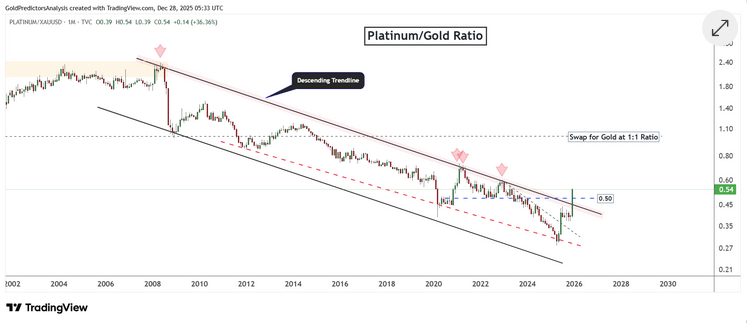
The ratio still remains significantly below parity, and the chances of mean reversion to the 1.0 level are still high. Traditionally, platinum was more valuable than gold; the existing change could be the first step towards returning to the old tradition.
Conclusion – Technical and Macro Forces Align for Higher Platinum in 2026
Platinum is now at phase 3 and is likely to skyrocket in 2026. The important drivers for this rally are structural deficits and tight physical supply. I think it is more than supply-demand imbalances that the 2025 parabolic trend represents. It is symptomatic of a greater change in the way the market is structured. The flow of investors and changes in global inventory are changing the price discovery.
The breakout of the $2,300 level in December 2025 was the final step in a multi-year base and triggered Phase 3 of the platinum super-cycle. The technical roadmap is pointing to a target level of $3,000 or higher. This bullish outlook remains valid as long as platinum holds above the key support levels at $2,170 and $2,300.
Read the full article HERE.
Gold staged a dramatic rally in 2025 as the US Trump administration’s unorthodox economic policies sent investors and central banks reaching for safe-haven assets. Right now, however, it’s silver that’s stealing the spotlight.
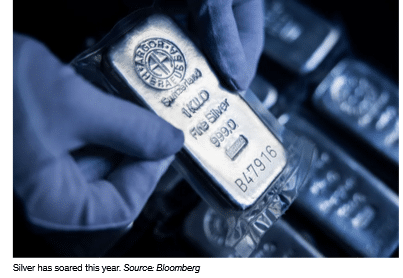
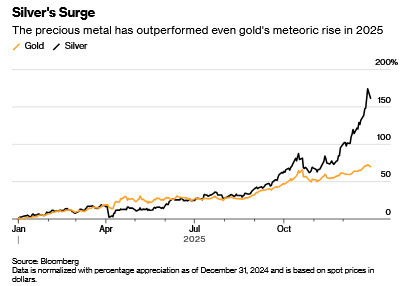
Surging investor demand collided with limited availability to catapult the price of silver above $80 a troy ounce at the end of December, almost triple its value a year earlier and enough to dwarf even gold’s meteoric rise of more than 70%.
Both precious metals have been experiencing a surge in demand from investors seeking to hedge against political turbulence, inflation and currency weakness. But unlike gold, silver has many properties that also make it a valuable ingredient in a range of industrial applications. Sustained high prices could erode the profitability of manufacturers that use it and spur efforts to substitute silver components for other metals.
Who needs silver?
Silver is an excellent electrical conductor that’s used in circuit boards and switches, electric vehicles and batteries. Silver paste is a critical ingredient in solar panels, and the metal is also used in coatings for medical devices.
Like gold, silver is still a popular ingredient for making jewelry and coins. China and India remain the top buyers of silver thanks to their vast industrial bases, large populations and the important role that silver jewelry continues to play as a store of value passed down the generations.
Governments and mints also consume large amounts of silver to produce bullion coins and other products. As a tradable asset, it’s much cheaper than gold per ounce, making it more accessible to retail investors, and its price tends to move more sharply during precious metal rallies.
What makes the silver market unique?
Silver’s varied uses mean its market price is influenced by a wide array of events including shifts in manufacturing cycles and interest rates and even renewable energy policy. When the global economy accelerates, industrial demand tends to push silver higher. When recessions loom, investors can step in as alternative buyers.
The market is thinner than that of gold. Daily turnover is smaller, inventories are tighter and liquidity can evaporate quickly. The silver stored in London is worth about $65 billion, while the gold is worth almost $1.3 trillion, though much of both are not available to borrow or buy for investors. For gold, the London market is underpinned by around $700 billion of bullion held mostly by the world’s central banks in vaults of the Bank of England. This can be lent out when a liquidity squeeze hits, effectively making the central banks lenders of last resort. No such reserve exists for silver.

Why did silver rally so much in 2025?
Silver often moves in tandem with gold, but with more violent price moves. A surge in gold in the early months of the year stretched the valuation gap between the two metals to the point where an ounce of gold could buy more than 100 times the same amount of silver. Some investors saw a potentially lucrative opportunity and piled in.
Heavy debt loads in major economies such as the US and France and a lack of political will to solve them also encouraged some investors to stock up on silver and other alternative assets, in a wider retreat from government bonds and currencies dubbed the debasement trade.
Meanwhile, global silver output has been constrained by declining ore grades and limited new project development. Mines in Mexico, Peru, and China — the top three producers — have all faced setbacks ranging from regulatory hurdles to environmental restrictions. Most of the world’s silver is extracted as a by-product from the mining of other metals.
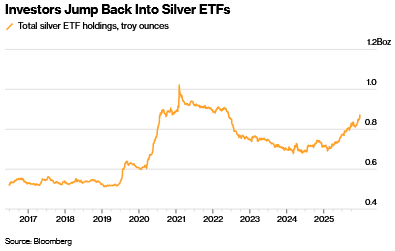
Global demand for silver has outpaced the output from mines for five years in a row, while silver-backed exchange-traded funds have drawn in new investment.
What was there a silver squeeze in 2025?
Speculation early in the year that the US would levy tariffs on silver led to a flood of metal heading into vaults linked to the Comex commodities exchange in New York, as traders sought to take advantage of premium prices in that market.
This contributed to a dwindling of available silver stocks in London, the dominant spot trading hub. Those were further eroded as more than 100 million ounces flowed into ETFs backed by physical bullion.
With a spike in demand during the Indian festive season in October, the market suddenly seized up. The cost of borrowing silver surged to a record, while prices jumped.
London prices rose above other international benchmarks, eventually drawing more silver into the market and helping to ease the supply squeeze.
Traders were still monitoring for any potential US tariff on silver after the precious metal was added to the US Geological Survey’s list of critical minerals in November. The market remained febrile into December, with speculation of any new development triggering sharp price moves.
The metal broke above $80 on Dec. 26 amid concerns around Chinese silver export restrictions that were announced in late October, even though these were effectively a rollover of previous policies. The rally was fueled partly by billionaire entrepreneur Elon Musk, who responded to comments about the Chinese policy on social media platform X with his own post: “This is not good. Silver is needed in many industrial processes.”
Read the full story HERE.