Key Points
- Bitcoin’s price fell less than 1% to $87,300, remaining in a short-term falling trend channel with resistance at $93,400.
- A crypto skeptic suggests investors are rotating out of Bitcoin into gold and silver, citing fund flow evidence.
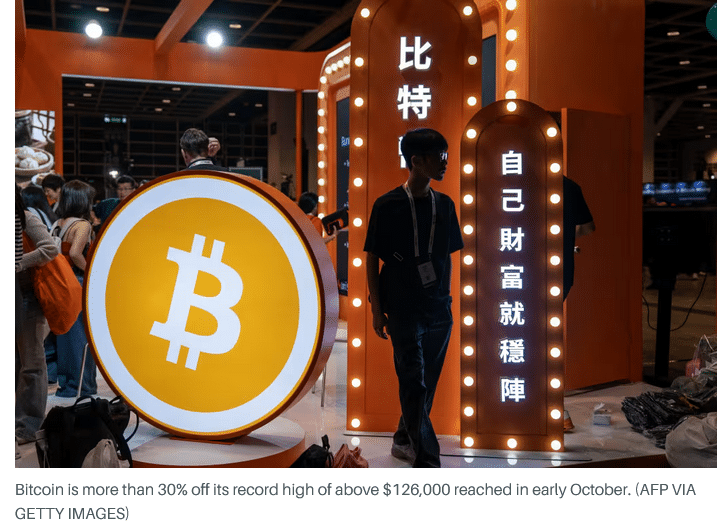
- Bitcoin has fallen over 33% since October 6, while gold rose 15% and silver jumped 50% to new highs.
Bitcoin and other cryptocurrencies were little changed on Christmas Eve, with digital assets looking set to miss out on any Santa Claus rally that sweeps stock markets. One crypto skeptic suggests silver and gold could be to blame.
The price of Bitcoin fell less than 1% over the past 24 hours to $87,300. Bitcoin hit a record high above $126,000 in October but has since fallen back dramatically amid deteriorating sentiment for digital assets.
“Bitcoin is in a falling trend channel in the short term. This shows that investors over time have sold at lower prices to get out of the currency, and indicates negative development,” wrote investing platform Investtech on Wednesday, based on technical market indicators. “[Bitcoin] has support at points $84,000 and resistance at points $93,400 … technically negative for the short term.”
With few obvious catalysts ahead and a weak technical backdrop, cryptos seem unlikely to benefit significantly from sentiment that could buoy wider markets, such as the much-anticipated “Santa Claus rally” typically seen in stocks. The S&P 500 for its part, hit an all-time high on Tuesday, with precious metals also rallying as goldGC00-0.24% and silver set their own fresh records.
In fact, gains for gold and silverSLV-1.50% could be a contributing factor to Bitcoin’s weakness, according to research published Tuesday by Walter J. Zimmerman Jr. of ICAP Technical Analysis.
Citing price trends and evidence of fund flows, Zimmerman suggests that investors have rotated out of Bitcoin and into precious metals. Bitcoin has fallen by more than a third since its peak on October 6, while gold has risen 15% to historic highs over that same period with silver similarly setting records with a 50% jump on the same timeline.
“[These] trends … are causally connected,” wrote Zimmerman. “We are looking at fund flows out of Bitcoin and into gold and silver.”
Beyond Bitcoin, Ethereum —the second-largest crypto—fell 1.5% to below $3,000. Smaller tokens or altcoins were also weaker, with XRP retreating 1.5%, Solana sliding 2%, and Dogecoin down 2%.
Read the full article HERE.

・Gold futures for February 2026 deliveries jumped 1% to $4,515.2 an ounce.
・Silver futures for March 2026 deliveries were up 0.8% at $69.6 an ounce.
・Silver, in particular, has rallied strongly in December, hitting new highs 11 times in the month.
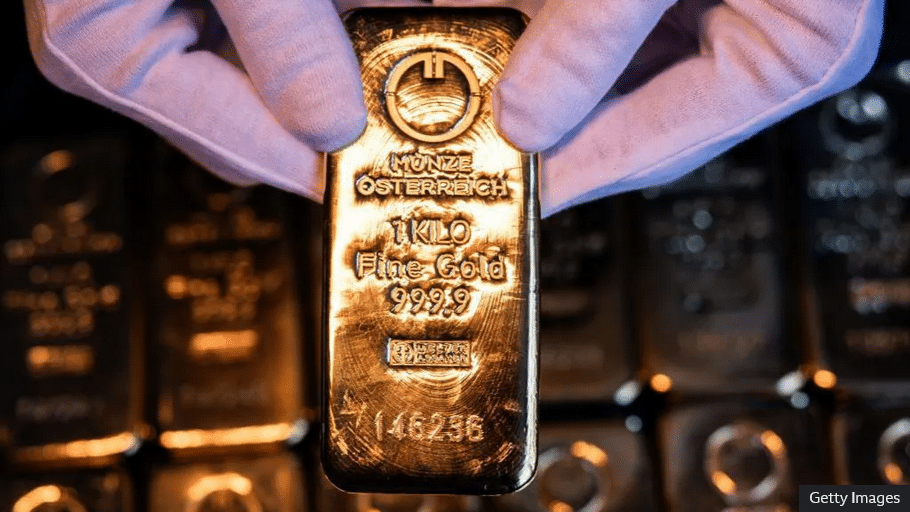
Precious metals are closing the year on a powerful note, as rising investor anxiety over policy, deficits, and inflation sent gold and silver surging to fresh all-time highs on Tuesday.
Spot gold (XAUUSD) rose to $4,497.69 an ounce, while spot silver (XAGUSD), which has been on a record-breaking run in December, nearly breached the $70 mark for the first time. Gold futures for February 2026 deliveries jumped 1% to $4,515.2 an ounce, while silver futures for March 2026 deliveries were up 0.8% at $69.6 an ounce.

Spot silver’s rally has seen the precious metal hit new highs 11 times in December alone.
Yardeni Forecasts $6,000 An Ounce
Yardeni Research reportedly raised its gold outlook on Monday, saying the sharp rally across precious metals reflects mounting macroeconomic and policy concerns rather than a rebound in global growth.
Gold prices are up about 69%, but gains in silver, platinum, and palladium have been even stronger, weakening the argument that industrial demand is driving the move. Yardeni noted that basic metals, which are closely tied to manufacturing, have lagged significantly.
While central bank buying helped fuel gold’s breakout above $2,000 an ounce in early 2024, the surge in other precious metals points to broader investor unease. The firm warned that an overly stimulative mix of U.S. monetary and fiscal policy could pressure bond yields, prompting it to raise its year-end 2026 gold target to $6,000 an ounce.
In an interview with CNBC-TV18 on Monday, Yardeni said that gold could climb up to $10,000 by the end of 2029.
Earlier this month, J.P. Morgan Global Research forecast prices to average $5,055 an ounce by the final quarter of 2026, rising toward $5,400 an ounce by the end of 2027.
“While this rally in gold has not, and will not, be linear, we believe the trends driving this rebasing higher in gold prices are not exhausted. The long-term trend of official reserve and investor diversification into gold has further to run. We expect gold demand to push prices toward $5,000/oz by year-end 2026,” said Natasha Kaneva, head of Global Commodities Strategy at J.P. Morgan.
How Have The ETFs Done?
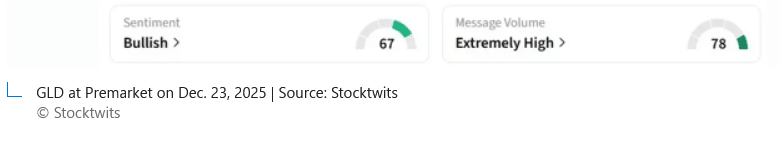
SPDR Gold (GLD) was up around 1% in premarket trading on Tuesday. It is on track to open at an all-time high.
Retail sentiment on Stocktwits remained ‘bullish’ over the past 24 hours, amid ‘extremely high’ message volumes. Its YTD gains stand at 67%.
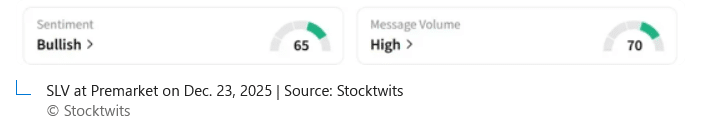
Meanwhile, iShares Silver Trust (SLV) was also up 1% in premarket, but its 2025 gains are nearly double GLD’s at 133%.
Retail sentiment for SLV on the platform remained ‘bullish’ amid ‘high’ message volumes.
Read the full article HERE.
The gold price has hit another record high, trading above $4,400 (£3,275) an ounce for the first time.
The price of the precious metal has risen on expectations the US central bank will cut interest rates further next year, analysts said.
Gold started the year worth $2,600 an ounce, but geopolitical tensions, the Trump tariffs and expectations of rate cuts have added to investor demand for safe haven assets, such as gold and other commodities.
The prices of other precious metals also rose on Monday, with silver hitting a record high as well.
The gold price has risen more than 68% this year, the highest increase since 1979, according to Adrian Ash, director of research at gold bullion marketplace BullionVault.
2025 has seen “slow-burning trends around interest rates, around war and trade tensions”, Mr Ash said, which have helped to push up the price of gold.
“The precious metals market says that President Trump has really triggered something – and gold has gone crazy this year.
“You’ve got the trade war, the attacks on the US Federal Reserve and you’ve got geopolitical tensions, all of those provocations come from Trump,” he said.
After passing the $4,400 an ounce mark on Monday, the spot price of gold hit a high of $4,426.66.
Lower interest rate expectations typically mean lower returns for investments such as bonds, so investors look to commodities such as gold and silver to get a return, but also diversify their portfolios.
The consensus among analysts currently is that the US will lower interest rates twice in 2026.
Another factor adding to demand is that central banks globally are expanding their own physical holdings of gold as a way to counter economic turbulence, reduce reliance on the US dollar, and diversify their own portfolios, according to analysis from Goldman Sachs, which predicted the pattern would continue in 2026.
The steady increase in the price of gold across the year could be because it is seen as a way for traders to help shield themselves from the threat of inflation and economic turmoil, Anita Wright, chartered financial planner at Ribble Wealth Management, said.
“When confidence in financial assets and policy stability starts to wobble, gold tends to respond first as the primary monetary metal,” Ms Wright said.
A weaker US dollar has also helped push gold prices higher by making the metal cheaper for overseas buyers.
Other precious metals have also had record years. The price of silver also hit a record of $69.44 an ounce on Monday.
For 2025 so far, silver is up 138% year-to-date and platinum is at a 17-year high, vastly outperforming gold, underpinned by strong and supply constraints, according to analysts.
Unlike gold, the other precious metals are also used widely in industrial manufacturing which helps stoke demand.
Separately, oil prices rose on Monday, after the US ordered a “blockade” last week of sanctioned oil tankers entering and leaving Venezuela.
The price of Brent crude rose $1.31 to $61.78 a barrel, while US oil was up $1.25 at $57.77. However, both measures look set to end 2025 at prices lower than where they started the year.
Read the full article HERE.
Inflation has been top-of-mind for years. That could change.

President Trump is clearly frustrated by all the talk of an “affordability crisis.” I don’t blame him. As Thursday’s admittedly distorted consumer-price index report showed, inflation simply isn’t behaving badly.
But don’t define affordability too narrowly. It means not just the prices we pay, but the means to pay them. We may be focusing too much on the first and not enough on the second.
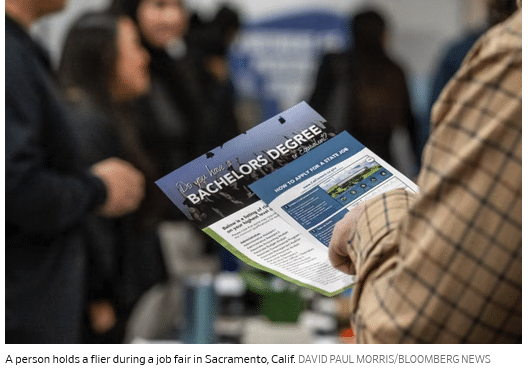
The inflation report was part of a deluge of data released this week, with a delay caused by the federal government shutdown. It also showed unemployment rising, to a four-year high of 4.6% in November, and earnings growth slowing.
Sometimes unemployment rises because a recession is under way. This time, something else is going on. Business leaders I have talked to in recent months are broadly optimistic about growth and pessimistic about hiring, especially their own. As their attitudes percolate down, we could see job security supplant prices in the public’s hierarchy of anxiety.

Prices rose a lot after the pandemic and haven’t broadly fallen since Trump took office, his promises to the contrary notwithstanding. But they are rising pretty slowly. Thursday’s report showed the inflation rate fell to 2.7% in November, the lowest since July, while core inflation, which excludes food and energy, fell to its lowest since 2021.
That report almost certainly understated inflation because of workarounds by the Labor Department’s Bureau of Labor Statistics in response to the shutdown.
Nonetheless, based on the data, you can’t argue that inflation has gotten worse under Trump. Odds are that in the coming year it will get better.
Trump is clearly frustrated that the public hasn’t rewarded him for a pretty good economy, just as Joe Biden was a year ago when growth, unemployment and inflation were broadly similar.
That is because economic anxiety is holistic. People have a nagging feeling that the economy isn’t working for them. That has shown up as anger at the high price of groceries, then the shortage of housing and now health insurance. But part of the equation is the security of your income and that is where the job market comes in.

Unemployment’s rise has been gradual and the level is still moderate, yet fragility is amply evident beneath the surface. The number of people working part time who wanted to work more leapt to 5.5 million in November, and is now up 23% from a year earlier. Those unemployed for more than half a year rose to 1.9 million from 1.8 million in September and 1.65 million a year earlier. It may not be a recession, but for anyone trying to find a job, it is starting to feel recession-like.
Meanwhile, average hourly earnings in November were up just 3.5% from a year earlier, the lowest since 2019 if pandemic-distorted figures are excluded. Other data do show firmer growth. But with employers reluctant to hire and unemployment growing, the pressure on wages is likely downward.
The question is why. Economic growth has topped 3% in the second and third quarter, according to the latest estimates. Corporate profits are strong, and the stock market is near record highs.
The labor market is usually closely linked to the pulse of the overall economy. Yet in its latest survey, the Business Roundtable finds that more chief executives plan to cut than add jobs for the third straight quarter, the lowest three-quarter reading since the 2007-09 recession.
One reason for the disconnect between the job market and the broader economy is tariffs. Economists expected them to show up as rising prices for imports. In real life, though, inputs don’t always map neatly to outputs. To cope with higher costs, whether for tariffs, energy, taxes, or health insurance, a business owner looks at all options, which may mean trimming head count instead of raising prices. Maybe it isn’t a coincidence that payroll growth stepped down sharply in the spring, just as Trump’s biggest tariff increases took effect, while the effect on inflation has been muted.
If so, relief is on the way. Tariff rates have stabilized and may actually drop if the Supreme Court rules against some in the coming weeks.
Yet even if the tariff effect fades, other headwinds remain, mostly artificial intelligence. “In three years this has gone from being a novelty party gag to being embedded in all your hiring plans and production,” Federal Reserve governor Chris Waller told executives at an event hosted by Yale University’s School of Management on Wednesday. “The speed at which jobs are going away is what’s frightening, and we are not able to see the jobs that are coming [although] they will come.”
Trump has locked arms with the AI industry. Politically, that could be a liability. Surveys by the Edelman Trust Institute find users in the U.S. are twice as likely to say they reject as embrace the growing use of AI. By a similar margin, they don’t believe business leaders are being fully honest about the impact on jobs.
The conventional wisdom in Washington is that costs will be the dominant issue heading into next fall’s midterm elections. The latest trends on AI and job security hint that the conventional wisdom may have to change.
Read the full article HERE.
An economist has warned that the recent increase in America’s unemployment rate represents an especially concerning signal for the labor market and wider U.S. economy.
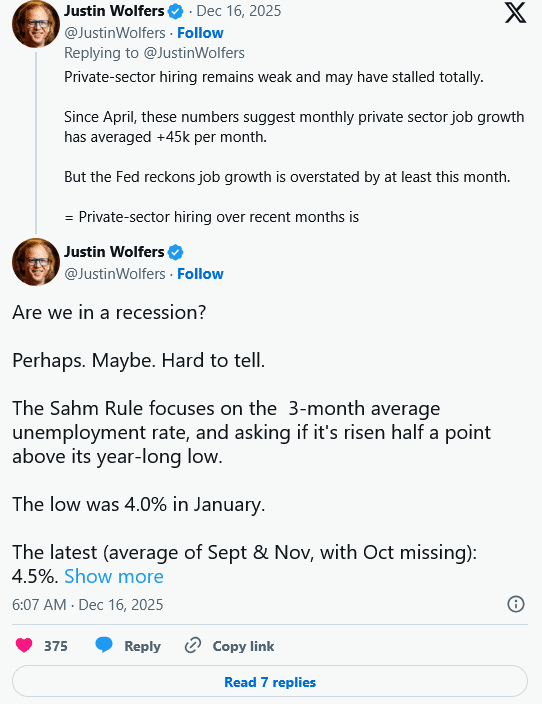
On X, Justin Wolfers, a professor of economics and public policy at the University of Michigan, said it was “hard to tell” whether the U.S. was already in an economic downturn, but pointed to the “Sahm Rule” as one concerning indicator.
This heuristic—employed by the Federal Reserve—charts early stage of recessions by whether the unemployment rate’s three-month moving average has risen 0.5 percent relative to the previous year’s minimum level.
As Wolfers notes, the three-month average climbed to 4.5 for September to November, after hitting a four-year high in Tuesday’s jobs report, compared to 4.0 percent in January.
“That’s up half a point, and it’s blinking red,” Wolfers posted to X.
Why It Matters
Talk of an impending recession eased in the fall, after GDP growth figures came in ahead of expectations and tariffs failed to result in as immediate or significant an increase in prices as some had feared.
However, some economists continue to express fears that it would take only a few shocks—such as the AI “bubble” bursting—to push the country into a major downturn, and that many states may already be in decline.
President Donald Trump gave his economy a grade of “A+++++” in a recent interview with Politico, but the tail end of 2025 has seen more Americans grappling with high and rising costs, surveys detailing consecutive drops in consumer confidence and, as Wolfers notes, a monthslong slowdown in hiring that is now combining with an uptick in layoff announcements.
What To Know
Wolfers, a frequent critic of the Trump administration’s economic agenda, issued his warning following Tuesday’s employment report, which combined payroll figures for October and November, given delays to regular releases due to the government shutdown.
The Bureau of Labor Statistics (BLS) revealed that the economy added 64,000 jobs in November, ahead of most forecasts, but shed 105,000 in October. The BLS said October’s decline was largely driven by government employees who accepted the administration’s deferred resignation offer earlier this year, and who came off the federal payrolls during the month.
While economists were pleased to get government employment data after a lengthy shutdown-induced fast, Bankrate senior economic analyst Mark Hamrick told Newsweek: “The not-so-good news is that it isn’t pretty.”

Job gains for the previous two months were also revised down by a total of 33,000, and as Wolfers wrote on Tuesday: “The headline numbers suggest VIRTUALLY NO EMPLOYMENT GROWTH since April.” Meanwhile, the unemployment rate rose to 4.6 percent, its highest level since September 2021, informing his pessimistic reading of the Sahm Rule.
But Claudia Sahm, the former Federal Reserve economist who developed the measure, told Newsweek that while rising unemployment “is a concern,” it is not yet “at levels typically seen in the early stages of a recession.”
She added that an extra complication was the Sahm Rule’s reliance on a three-month average, and the absence of an October unemployment rate, which the BLS did not calculate or release citing data collection issues caused by the shutdown.
“I would be cautious with standard ‘rules of thumb’ for the next few months,” she told Newsweek.
What People Are Saying
Market analyst Daniela Hathorn, in comments shared with Newsweek following Tuesday’s report, said: “The figures confirm that job growth remains modest and the labor market continues to slow, with 64,000 payrolls added in November after a dip in October, a clear deceleration from prior months. The unemployment rate rose slightly higher than expected at 4.6 percentage, further softening from earlier in the year, and wage growth continues to ease modestly compared with previous months. All told, this is consistent with a labor market that is losing steam rather than overheating.”
Kevin Hassett, director of the National Economic Council, told CNBC after the reading: “We dropped about 160,000 government workers—federal government—who are the people who took the buyout that, you know, we began that program in spring and gave people until the fall to step aside. And so, I think that from the private sector point of view it’s just about what we’ve been getting all year. It’s [a] solid upward trajectory.”
Read the full article HERE.
Two months before Black Monday, the market crash that led to the Great Depression, a Massachusetts economist named Roger Babson, fretting over a wave of mom-and-pop investors borrowing money to buy stocks, declared in a speech that “sooner or later a crash is coming and it may be terrific.” Afterward, the market sank 3%, a dip known at the time as the “Babson Break.” But in the weeks that followed, writes Andrew Ross Sorkin in his engrossing new history, 1929: Inside the Greatest Crash in Wall Street History—and How It Shattered a Nation, “the market shook off Babson’s foreboding,” in part because of optimism over new mass-market products like the radio and the automobile. “Investors with an ‘imagination’ were winning again.”
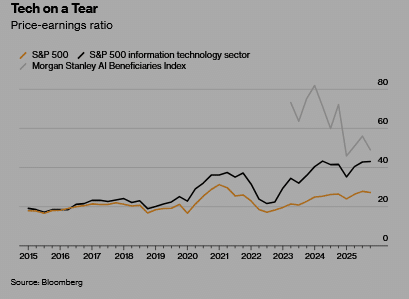
Today there are many Cassandras like Babson warning about AI, in particular the valuation of public and private technology companies and their headlong pursuit of the elusive goal of artificial general intelligence (systems that can do just about anything a human can do and more). Tech companies are on pace to spend just shy of $1.6 trillion annually on data centers by 2030, according to data analyst Omdia. The magnitude of the hype around AI, whose prospects as a profit maker remain entirely hypothetical, has confounded many sober-minded investors. Yet now, as a century ago, the idea of missing out on the next big thing has persuaded many companies to ignore such prophecies of doom. They “are all kind of playing a game of Mad Libs where they think these moonshot technologies will solve any existing problem,” says Advait Arun, a climate finance and energy infrastructure analyst at the Center for Public Enterprise, whose recent Babsonesque report, Bubble or Nothing, questioned the financing schemes behind data center projects. “We are definitely still in the irrational exuberance stage.”
Journalists usually would be wise to abstain from debating whether a resource or technology is overvalued. I have no strong opinion on whether we’re in an AI bubble, but I wonder if the question may be too narrow. If you define a speculative bubble as any phenomenon where the worth of a certain asset rises unsustainably beyond a definable fundamental value, then bubbles are pretty much everywhere you look. And they seem to be inflating and deflating in lockstep.
There may be a bubble in gold, whose price has soared almost 64% in the year to Dec. 12, and one in government debt, according to Børge Brende, chief executive officer of the World Economic Forum, who recently observed that nations collectively haven’t operated this deeply in the red since World War II. Many financiers believe there’s a bubble in private credit, the $3 trillion market in loans by large investment houses (many for the purpose of building AI data centers) that’s outside the heavily regulated commercial banking system. Jeffrey Gundlach, founder and CEO of money-management firm DoubleLine Capital, recently called this opaque, unregulated free-for-all “garbage lending” on the Bloomberg podcast Odd Lots. Jamie Dimon, JPMorgan Chase & Co.’s CEO, dubbed it “a recipe for a financial crisis.”
The most obvious absurdities have materialized, where there’s no easy way to judge an asset’s intrinsic worth. The total market value of Bitcoin, for example, rose $636 billion from the start of the year through Oct. 6—before losing all of that and more, as of Dec. 12. The trading volume of memecoins, those virtual contrivances that commemorate online trends, peaked at $170 billion in January, according to crypto media firm Blockworks, but by September had collapsed to $19 billion. Leading the decline were the $TRUMP and $MELANIA coins, launched by the first family two days before Inauguration Day, which have lost 88% and 99% of their worth, respectively, since Jan. 19.
Many investors evaluated these crypto currencies not for their potential to create underlying value for shareholders and the world—the way they might for a stock in a conventional company that reports earnings, for example—but more narrowly for the chance to make a lot of money quickly. They approached it a little like they would sidling up to the craps table on a trip to Las Vegas.
There might be demographic reasons that investors, particularly those drawn to crypto, sports gambling and online prediction markets, are trying to game financial markets as if they were casinos. According to a recent Harris poll, 6 in 10 Americans now aspire to accumulate extreme wealth. Seventy percent of Gen Z and millennial respondents say they want to become billionaires, versus 51% of Gen Xers and boomers. A study last year by the financial firm Empower suggested that Zoomers believe that “financial success” requires a salary of nearly $600,000 and a net worth of $10 million.
Thanks to TikTok videos, group chats, Reddit boards and the instantaneous and unavoidable nature of the internet, everyone in the world is now apprised of moneymaking opportunities at the same time. That sounds fine in principle but has led to a frenzy of imitation, mass competition and hive-mind behavior that makes the new Apple TV show Pluribus look timely. The traditional economy, with its complicated and infinitely varied dimensions, has been supplanted by the attention economy—the things we’re all, everywhere, obsessing about at any particular time.
In the business world, that singular focus is on AI. In popular culture there was a Sydney Sweeney bubble, which followed a Pedro Pascal bubble, and a “6-7” bubble. (If you don’t have teens, just Google it.) Over the past year, thanks to celebrities such as Lisa from the K-pop band Blackpink, we also have a worldwide mania over the cute but worthless zoomorphic stuffies sold by Chinese toymaker Pop Mart International Group. Call it the Labubble.
In food there’s most certainly a protein bubble, with everyone from the makers of popcorn to breakfast cereal marketing their protein content to appeal to health-conscious consumers and GLP-1 users. In media there just might be a bubble in Substack newsletters, celebrity-hosted podcasts (Amy Poehler’s Good Hang and Meghan Markle’s Confessions of a Female Founder) and celebrity-focused documentary biopics authorized by their subjects and available to stream nearly every week (the latest on Netflix: Being Eddie on Eddie Murphy, and Victoria Beckham). “Everyone’s reference group is global and goes far beyond what they can see around them and beyond what their actual class or position is,” says W. David Marx, the author of Blank Space: A Cultural History of the Twenty-First Century. “You can have globally aligned movements within these markets that in the past would have been impossible.”
The stakes are higher for AI than they are for Labubus, of course. No company wants to be left behind, and so every major player is plowing forward, building computing infrastructure using complex financing arrangements. In some cases this involves a special purpose vehicle (remember those from the 2008 financial crash?) loaded with debt to buy Nvidia Corp. graphics processors, the AI chips that some observers think may depreciate more quickly than expected.
The tech giants can weather any fallout from this FOMO-induced stampede. They’re paying for their data centers largely from their robust balance sheets and can navigate the consequences if white-collar workers all decide that, say, the current version of ChatGPT is plenty good enough to craft their annual self-evaluation. But other companies are engaging in riskier behavior. Oracle Corp., a stodgy database provider and an unlikely challenger in the AI rush, is raising $38 billion in debt to build data centers in Texas and Wisconsin.
Other so-called neoclouds, relatively young companies such as CoreWeave Inc. and Fluidstack Ltd. building specialized data centers for AI, Bitcoin mining and other purposes, are also borrowing heavily. Suddenly the cumulative impact of an AI bubble begins to look more severe. “When we have entities building tens of billions worth of data centers based on borrowed money without real customers, that is when I start worrying,” says Gil Luria, managing director at investment firm D.A. Davidson & Co., evoking Roger Babson from a century ago. “Lending money to a speculative investment is never a good idea.”
Carlota Perez, a British-Venezuelan researcher who’s been writing about economic boom and bust cycles for decades, is concerned as well. She says innovation in tech is being turned into high-stakes speculation in a casino economy that’s overleveraged, fragile and prone to bubbles ready to pop as soon as active doubt begins to spread. “If AI and crypto were to crash, they are likely to trigger a global collapse of unimaginable proportions,” she wrote in an email. “Historically, it is only when finance suffers the consequences of its own behavior, instead of being perpetually bailed out, and when society reins it in with proper regulation, that truly productive golden ages ensue.” Until then, hold your Labubus tightly.
Read the full article HERE.
The 4.6% rate is the highest in more than four years, according to a delayed government report

Quick Summary
- The U.S. unemployment rate increased to 4.6% in November, its highest in over four years, up from 4.4% in September.
The U.S. unemployment rate rose to 4.6% in November, its highest in more than four years, fueling questions about the American economy’s underlying strength.
A long-delayed government report on Tuesday showed that 64,000 jobs were gained in November, while 105,000 jobs were lost in October.
The unemployment rate in November rose to 4.6%, from 4.4% in September, the last month the Labor Department had reported the unemployment rate.
U.S. stock futures were steady following the government’s release.
The department published two months of data instead of one, after pausing its data collections during the 43-day government shutdown. An unemployment rate for October wasn’t available because, during the shutdown, officials weren’t able to conduct the survey needed to calculate that number.
Economists polled by The Wall Street Journal had expected a gain of 45,000 jobs in November, and a 4.5% unemployment rate.

The Journal didn’t survey forecasters about their expectations for the October jobs number, but economists had generally expected a decline, in part because of government layoffs from earlier this year finally kicking in.
Federal-government employment shrank by 6,000 jobs in November, adding to a massive loss of 162,000 federal jobs in October. Federal-government employment is down by 271,000 since January, the Labor Department said.
Tuesday’s report offers new clues about a job market that has cooled significantly in recent months. Rising inflation and tariff uncertainty have prevented companies from expanding their workforces. But the Trump administration’s policies targeting immigrants have also curbed the number of job seekers. That has meant that labor demand hasn’t had to grow as quickly to prevent rising unemployment.

Job numbers for September and August were worse than previously reported. Some 108,000 jobs were added in September, lower than the 119,000 gain previously reported; 26,000 jobs were lost in August, instead of the previously estimated 4,000 decline.
Job losses in June, August and October mean the U.S. economy has shed jobs in three out of the past six months.
Overall, economists describe the current labor market as a low-fire, low-hire environment. Most companies aren’t laying off workers en masse. But they also aren’t willing to hire too many new workers—in part because they believe that a lot of those tasks can be filled by artificial intelligence. Many companies that typically rush to hire temp workers at this time of year are sitting tight.
The report was eagerly anticipated after economists for months had to rely mostly on backward-looking government indicators and alternate data from the private sector.
The new jobs numbers are part of a significant batch of data that were delayed but will be available for the Federal Reserve by its next meeting in late January. A cooling labor market was behind its decision to cut interest rates last Wednesday.
Still, Fed Chair Jerome Powell cautioned last week that officials would look at incoming data with a “somewhat skeptical eye” because data wasn’t collected in October and half of November.
He also said Wednesday that official statistics could be overestimating job creation by up to 60,000 jobs a month, meaning the U.S. could have lost 20,000 jobs a month since April. Powell’s concern there involves estimates the Labor Department has to make when it is trying to measure jobs added or destroyed from new businesses being created or shutting down.
Read the full article HERE.
Gold rose for a fifth day — nearing a fresh record — with doubts about the valuations of technology stocks and the outlook for US borrowing costs at the forefront of investors’ minds.
Bullion climbed as much as 1.2%, and is in its longest winning streak since the run-up to an all-time high in October. On Friday, gold and silver suffered a sudden pullback from the day’s highs in a broad risk-off move as Wall Street traders took profits on the year’s biggest artificial intelligence winners. Gold is sometimes seen as a way to hedge against downside in equities, although the metal’s short-term correlation to stocks has risen in recent months.
Forecasts for bullion prices will also be shaped by expectations of Federal Reserve interest-rate cuts next year. Weak US non-farm payroll numbers on Tuesday would raise the prospect of more reductions, a tailwind for non-yielding gold.

In an interview with the Wall Street Journal on Friday, President Donald Trump called for aggressively lowering rates and said he expects the next Fed chair to consult with him on monetary policy. He named Kevin Hassett and Kevin Warsh as his top choices to succeed Jerome Powell.
Gold has surged about 65% this year and silver has more than doubled, with both metals on track for their best annual performances since 1979. Holdings in gold-backed exchange-traded funds have risen every month this year except May, according to the World Gold Council.
“We still expect continued central-bank buying, alongside private investor flows under Fed easing, to lift gold prices to $4,900 by end-2026,” Goldman Sachs Group Inc. analysts including Lina Thomas said in a note. Elevated accumulation by central banks was “a multiyear trend,” they said, reiterating a forecast for average monthly purchases of 70 tons in 2026.
Bullion faces a year of two halves in 2026, peaking near $4,800 before the end of the second quarter before retreating, ANZ Group Holdings Ltd. analysts Soni Kumari and Daniel Hynes said in a note. They also cited “resilient” investment flows and central-bank buying as supportive factors.
Silver, meanwhile, has been bolstered in recent weeks by speculative bets on lingering supply tightness after a historic squeeze in October. The white metal — which hit a record of $64.6573 an ounce on Friday — will continue to find support from a market deficit, as well as resilient industrial demand and uncertainty around US import policy, ANZ said.
The US Geological Survey added silver to its critical minerals list last month, and traders are cautious about taking silver out of America in the event that import tariffs are later imposed. The ANZ analysts said they expected silver to be excluded from tariffs, with confirmation of such a decision likely to prompt outflows of the metal and ease tightness.
Gold gained 0.9% to $4,339.22 an ounce as of 10:46 a.m. in London, nearing October’s record of $4,381.52. Silver gained 2.8% to $63.7102, recouping its losses on Friday. Platinum jumped as much as 3.2% to its highest since September 2011, and palladium also rose. The Bloomberg Dollar Spot Index was down 0.1%.
Read the full article HERE.
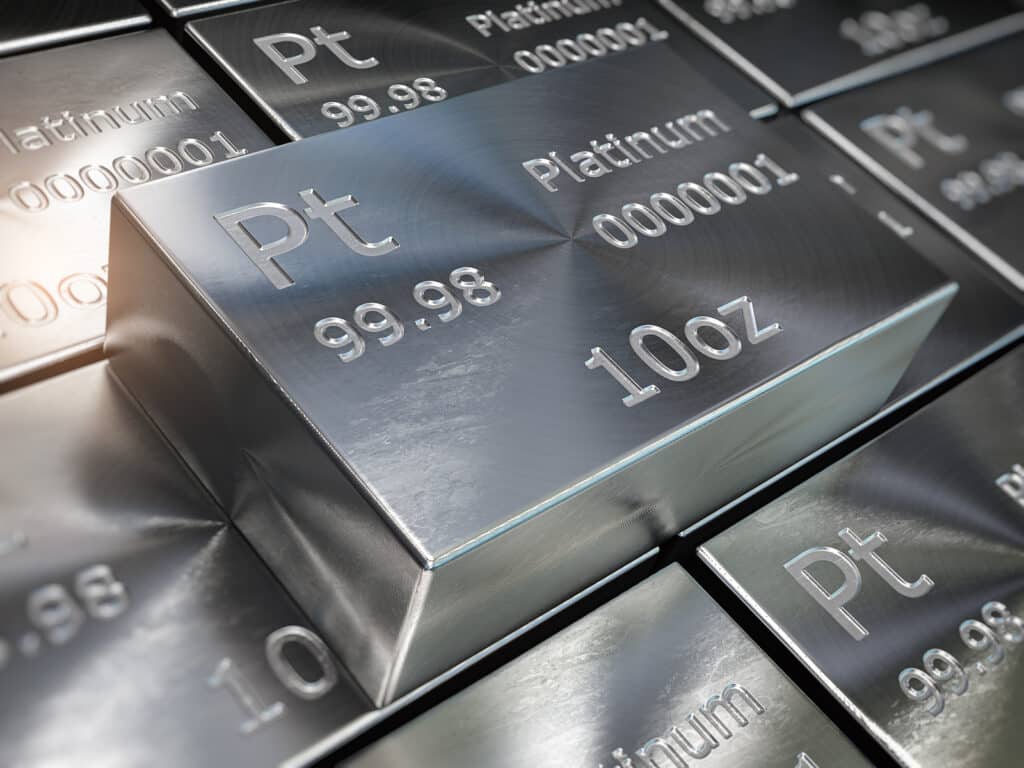
“Precious metals are not used because they are cheap,” according to Matthew Turner, market intelligence manager at Valterra Platinum, one of the world’s leading platinum group metals (PGMs) producers. “By weight, they are thousands of times more valuable than, say, oil or base metals – they are used because they are good at what they do. They don’t have that many substitutes.”
Mainly for this reason, Turner doesn’t expect China’s recent decision to remove a 13% value added tax (VAT) exemption on platinum imports to trigger a slump in demand from the country, which consumes 30% of the metal used in a plethora of industries.
“Demand is inelastic to price. If prices go up by say 5%, that doesn’t mean China will use 5% less, meaning this price increase shouldn’t have a long-term impact,” he said.
Turner’s comments come as investors have become enamored with platinum – its value has soared in 2025 due factors like a three-year structural deficit and strong appetite for gold, whose price it tends to closely track.
As of early December, platinum prices had climbed almost 80% this year to nearly $1,600 per ounce, eclipsing its close cousin palladium’s 70% jump and outpacing gold’s 58% gains respectively.
Platinum has many industrial uses. The biggest consumer is the automotive industry, mainly for catalytic converters in diesel vehicles, though the chemicals and energy industries are also big buyers, employing it for fertilizers, premium glass and fiber optics. The jewelry industry uses the white metal to make watches, rings and necklaces, primarily in China and North America, but also increasingly in India.
Deficit to Continue
Edward Sterck, research director at the World Platinum Investment Council (WPIC), expects 2025 to end with an 850,000 ounce deficit as supply lags demand. However, he sees the deficit gradually narrowing by 2029 when it could come in at 486,000 ounces amid a bounce in recycling activities.
“Demand could be a little shy of 8 million ounces this year while supply will stay flat in the range of 7.2 to 7.3 million ounces,” according to Sterck.
“Recycling has been rather suppressed in the past three years but we are seeing a recovery supported by higher prices which is why we see a smaller deficit in the future,” he added.
The bulk of the material will likely come from the automotive sector where 27 million cars are set to be scrapped annually, according to Global Car Recycling Day. Producers can repurpose the platinum, palladium and rhodium used to make the catalytic converters found in cars’ exhaust pipes, helping boost inventory.
Wilma Swarts, director of PGMs at precious metals consultancy Metals Focus, said a lack of expansion capital investment, particularly in South Africa (which accounts for 70% of global output) “is putting a drag on mine supply and exacerbating the deficit.”
South Africa has suffered from flooding due to heavy rainfall at the start of the year as well as unplanned maintenance brought about by equipment failure due to the significant power outages in the past. In other top producing countries like Russia or Zimbabwe, there is a lack of any significant, financially viable brownfield or greenfield projects that could meaningfully replace the depletion seen in existing aging assets in the foreseeable future.
“Platinum has always had both an industrial and investment underpin to it, though for the last two years platinum seemed to have disconnected from gold and traded range bound despite the higher gold price.”
— Wilma Swarts, Director of PGMs at Metals Focus
A Precious Metals Rally
This year’s staggering price rise has stemmed from a combination of multi-year supply-demand imbalances, as well as the gold price rally.
“Even though the fundamentals are robust for platinum, a lot of the lift it’s experiencing is associated with what we’re seeing across the commodity complex,” Swarts said. “Platinum has always had both an industrial and investment underpin to it, though for the last two years platinum seemed to have disconnected from gold and traded range bound despite the higher gold price. More recently as explained before, the correlation has been restored.”
In China, the high gold price saw some jewelry manufacturers switch a portion of their inventory to platinum jewelry.
Swarts said jeweler demand has broadened beyond China, which has historically been the dominant jewelry consumption region. Strong growth in the U.S., Europe and notably India has meant that demand is more evenly distributed across all regions.
“In the past two to three years, we have seen India grow tremendously,” Swarts said. “If we think back to 2013, demand was around 38,000 ounces and is now closer to 200,000 ounces.”
Conversely, platinum purchases from the auto industry are declining as a result of the electric vehicle (EV) revolution, though rising platinum substitution against more expensive palladium for gasoline converters is helping offset some of the losses.
Analysts say the hydrogen economy, with its platinum usage set to grow at a faster pace than in other industries by 2030, could also provide a buffer against EV-led headwinds.
Uptake is forecast to increase to 875,000-900,000 ounces by 2030, according to the WPIC. Fuel cell electric vehicles (FECV), especially for heavy-duty trucks and buses, and so-called electrolyzers needed to power green hydrogen (energy made from water and renewable sources), will drive growth, alongside stationary or backup power facilities, it adds.
“We’re seeing increased interest from firms across the physical supply chain, from producers to major consumers in the oil and gas industry.”
— Yang Lu, Senior Director of Metals Products at CME Group
Risk Management
Amid these changing conditions, there’s been a strong increase in demand for platinum derivatives to manage price risk. CME Group Platinum futures average daily volume (ADV) rose 22% to 38,000 contracts as of the third quarter. Meanwhile, a record-breaking 9,500 Platinum options contracts were traded on October 24.
“We’re seeing increased interest from firms across the physical supply chain, from producers to major consumers in the oil and gas industry,” said Yang Lu, Senior Director of Metals Products at CME Group.
Swarts said oil and gas firms can be big buyers of platinum and could benefit from using the futures exchange to mitigate risk. Oil and gas companies use platinum and palladium as catalysts in the refining process during the conversion of crude oil to gasoline, diesel and related petrochemical products.
“There is a significant amount of platinum locked up in the petroleum and petrochemical refining process,” said Swarts. “Whether its price exposure from new plant expansions, selling it if a plant decomissions or topping up of existing catalysts during a change out process,” the petroleum refiners can be very sensitive to pricing.
Derivatives can also help refiners manage price risk and assess whether to lease (borrow) the metal or purchase it directly, Swarts added. Amid market tightness, platinum lease rates have surged to historic highs which have likely triggered some companies to increase direct purchases/ownership of metal.
Economic, Geopolitical Risks
Looking ahead, Turner noted he will keep a close eye on the automotive powertrain to better understand future demand, especially as the market is in flux.
“There is a shift to Battery Electric Vehicles (BEVs) that don’t use PGM catalysts which is a negative [for platinum] but this year, we are seeing a divergence in this trend,” Turner said. “China has more rapidly developed BEVs as well as hybrid vehicles whereas the U.S. has gone the other way. You have seen sales falling at Tesla and the traditional carmakers announcing they will produce hybrid and other combustion cars for longer than anticipated.”
Added Turner: “And of course, we have seen political changes in the U.S. like the tax credit removal and the EPA’s [Environmental Protection Agency] decision to step back from CO2 regulation. These risk further deceleration.”
The global economic outlook, coupled with lingering geopolitical tensions, will also likely impact platinum.
“One of the drivers for PGMs has been that the global economy has proven more resilient than expected and tariffs have not been such a big deal,” said Turner. “But that could change. People are watching things like corporate credit and the U.S. labor market for signs of a slowdown. This could be a risk for PGMs as their performance is linked to industrial demand.”
What Could Unwind the Deficit?
On top of recycling, could anything else curb the production shortfall?
Sterck said roughly 3.2 million ounces of platinum are held in exchange traded funds (ETFs), so if prices continue to rise, some people may be encouraged to take profits and unwind their positions.
If tariff tensions subside, some of the above-ground stocks people accumulated in recent years amid heightened uncertainty could also be offloaded, helping shore up supply, he concluded.
As these dynamics continue to unfold, platinum’s role in both industry and in investment portfolios will likely be top of mind for market participants.
Read the full article HERE.
Key Points
- Silver prices reached a new all-time high of $61.62 per ounce, marking a 104% annual advance, driven by inflation hedging and industrial demand.
- The metal’s dual role as an inflation hedge and an industrial component for AI data centers and electric vehicles intensified demand.
- Supply constraints, including low stockpiles in Shanghai and increased imports due to expected 2026 tariffs, contributed to the price surge.
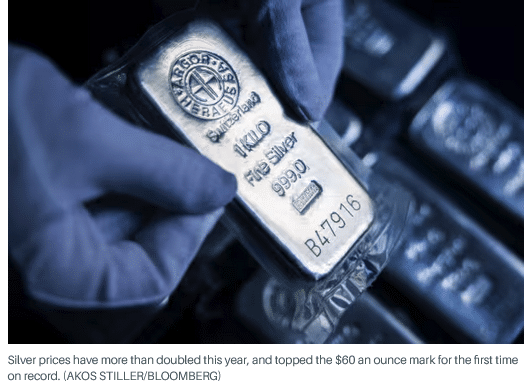
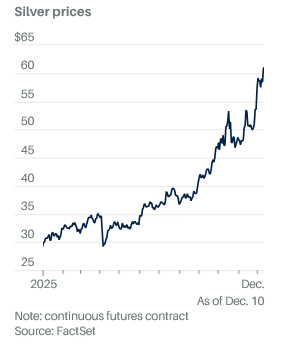
Silver prices +3.60% surged to a fresh all-time high on Wednesday, topping the $60 an ounce mark for the first time on record, as investors continue to seek inflation hedges and industrial alternatives to goldGC00+1.02% and digital currencies.
The white metal is finding a place in investment portfolios as both a hedge against inflation and the protection against currencies losing value, as well as an industrial play on new technologies powering global growth.
Silver remains a key component in the buildout of artificial-intelligence data centers and the production of electric vehicles, both of which have intensified demand and catapulted prices over the past year. It’s also used in solar cells and anti-bacterial medical instruments.
Spot silver prices were 1.6% higher in Wednesday trading, changing hands at $61.62 an ounce. The metal’s price has more than doubled this year.
Gold prices, which also hit record highs again last month, have risen around 60% this year.
“Silver’s relentless surge in 2025 will be remembered as one of the most dramatic revaluations in modern precious metals history,” said Saxo Bank’s head of commodity strategy Ole Hansen.
“Having spent much of the past decade oscillating between being perceived as a monetary metal and an industrial input, silver finally resolved that identity crisis this year by being both at the same time — just as supply constraints became impossible to ignore,” he added.
Silver’s place on the list of “critical minerals” published by the U.S. Geological Survey was also completed last month, and tariffs expected on the metal in 2026 have stoked an enormous wave of imports that has drained supply in other markets around the world.
“This has put other regions under pressure,” said Ewa Manthey, commodities strategist at ING. “Stockpiles in warehouses linked to the Shanghai Futures Exchange recently hit their lowest in nearly a decade, with a large volume shipped to London to ease the squeeze there.”
Manthey expects this dynamic, as well as expected central bank policy easing and U.S. dollar weakness, will continue to support silver prices into the coming year.
“Historically, silver has outperformed gold during easing cycles, as lower real yields tend to lift both investor allocation and industrial activity,” she said.
Hansen at Saxo Bank also notes that even if longer-dated government bond yields continue their recent climb and prevent central banks from delivering rate cuts, silver is still likely to outperform.
“While higher long-end yields would normally be a headwind for precious metals, this time they may send a different signal—namely unease about inflation persistence and fiscal expansion,” he said. “In that scenario, higher yields could paradoxically reinforce demand for silver and gold as portfolio hedges.”
One challenge for U.S. investors, however, is finding a blue-chip play on silver demand outside of the spot and futures markets.
The world’s biggest listed silver mining company, Mexico-based Fresnillo is listed on the London Stock Exchange. Other companies, such as Pan America SilverPAAS+3.66% and Hecla Mining, carry modest market values of around $20 billion and $10 billion, respectively.
That has driven retail investors into silver-backed exchange-traded funds, which have taken in more than 130 million ounces this year, an 18% increase from 2024 levels.
However, speculators are reducing their bets on extended gains, thanks in part to increased volumes and volatility. Commodity Futures Trading Commission data now suggest the number of investors betting on near-term price increases has fallen to the lowest level in 19 months.
“Given that silver’s market turnover is roughly eight to ten times smaller than gold’s, this imbalance matters,” Hansen cautioned. “It helps explain why relatively modest shifts in gold prices or silver sentiment in general can translate into outsized moves—both up and down.”
Read the full article HERE.