Summary
- Silver hits all-time high of $60.74/oz
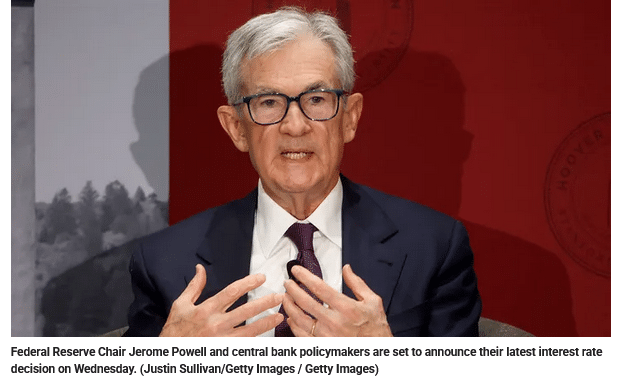
- FOMC policy meeting on December 9-10
- Traders see 87.4% chance of a December rate cut
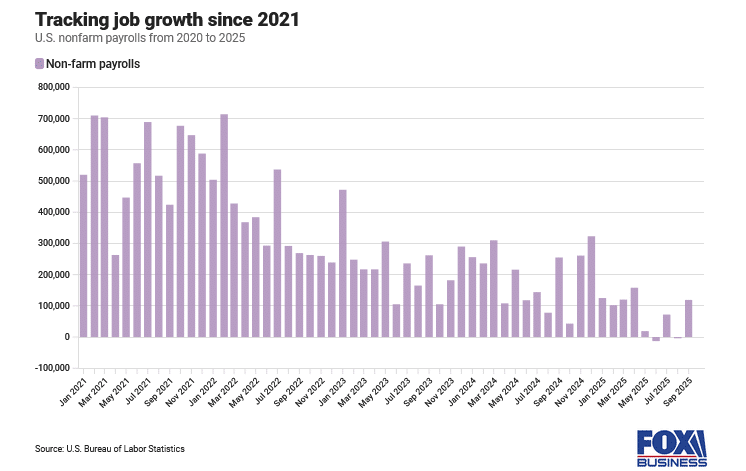
- Data shows U.S. job openings increased marginally in October
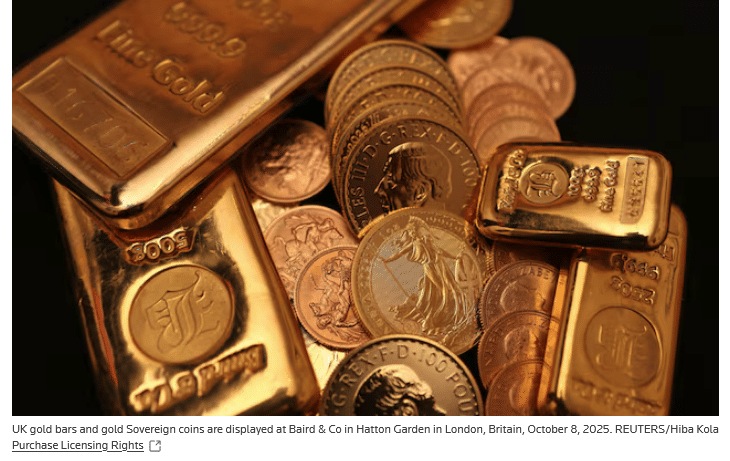
Gold gained on Tuesday as traders remained optimistic ahead of the U.S. Federal Reserve’s interest rate decision, while silver rose to hit an unprecedented $60 per ounce milestone amid supply constraints.
Spot gold rose 0.6% to $4,211.77 per ounce by 03:21 p.m. ET (2021 GMT). U.S. gold futures for February delivery settled 0.4% higher at $4,236.2 per ounce.
Spot silver climbed 4.3% to $60.74 per ounce, hitting an all-time high.
“People are anticipating that there’s going to be strong industrial demand for silver for years to come, which is why it’s been bid up, the silver price,” said Fawad Razaqzada, market analyst at City Index and FOREX.com, adding that the buying momentum is strong at the moment.
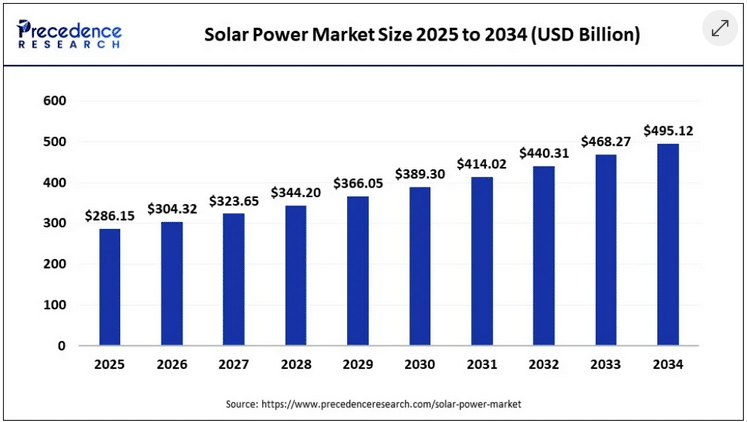
Sectors including solar energy, electric vehicles and their infrastructure, and data centers and artificial intelligence will drive industrial demand higher through 2030, the Silver Institute industry association said in a research report.
Silver prices have also been supported by persistently low supplies and dwindling global inventories, expectations of the Fed easing interest rates, as well as its recent addition to the U.S. critical minerals list.
“Metals are volatile by nature, but unless we fix the deficit, silver only has one way to go, and that is up,” said Maria Smirnova, senior portfolio manager and chief investment officer at Sprott Asset Management.
On the U.S. policy front, the Fed’s two-day meeting ends with a decision on Wednesday. Traders now see an 87.4% chance of a 25-basis-point cut this week.
“The move in gold right now is attributed to the big spike in silver and the high expectations for another quarter-point cut,” said RJO Futures senior market strategist Bob Haberkorn.
Meanwhile, the U.S. Labor Department’s JOLTS report showed job openings rose to 7.67 million in October, beating forecasts of 7.15 million, indicating a strong labor market.
Gold has shrugged off the jobs report, Haberkorn said, adding “we could see silver trade over $70 an ounce in the first half of 2026, and gold is on a path towards $5,000 an ounce.”
Platinum gained 2.8% to $1,688.39/oz, while palladium rose 2.6% to $1,503.74/oz.
Read the full story HERE.
Silver surged to a record high as soaring ETF inflows, rising industrial demand, expectations of a Fed rate cut, and a falling gold-silver ratio point to a continued rally toward $62 and potentially $100.

Silver (XAG) prices surged to a record high of $59.33 last week, driven by soaring ETF inflows, rising industrial demand, and expectations of a Fed rate cut. In my view, this shift in the macro backdrop sets the stage for a continued rally toward $62 and potentially $100 in the coming months. This article presents the key macro drivers, technical breakout patterns, and confirmation signals that support this bullish outlook.
Macro Forces Align to Fuel Silver’s Breakout in 2025
A mix of monetary, structural, and geopolitical forces drives silver’s surge in 2025. The metal hit a record high of $59.33 last week and is on pace for its second-best year ever. This momentum reflects deep shifts in both investor positioning and industrial supply dynamics.
ETF Inflows, Fed Policy, and Monetary Shifts Support the Rally
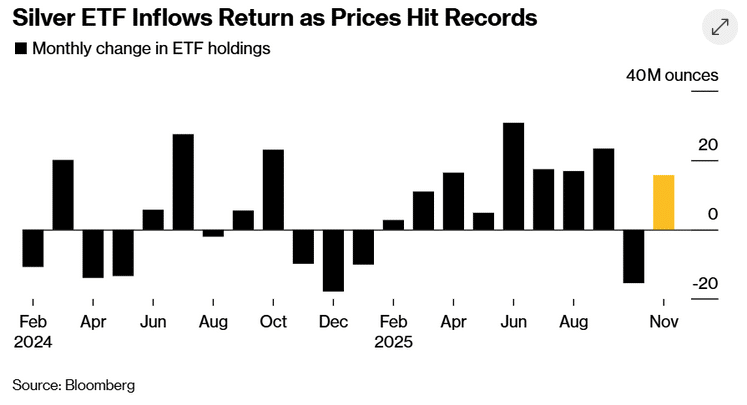
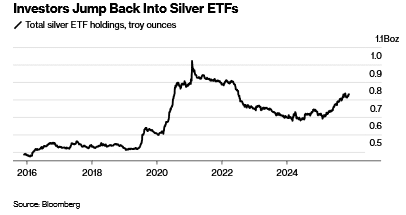
The silver rally is supported by capital flowing into silver‑backed ETFs. The chart below shows that investors added 15.7 million ounces in November, marking the largest monthly inflow since July. ETF demand has increased in 9 of the past 11 months, highlighting persistent institutional interest.
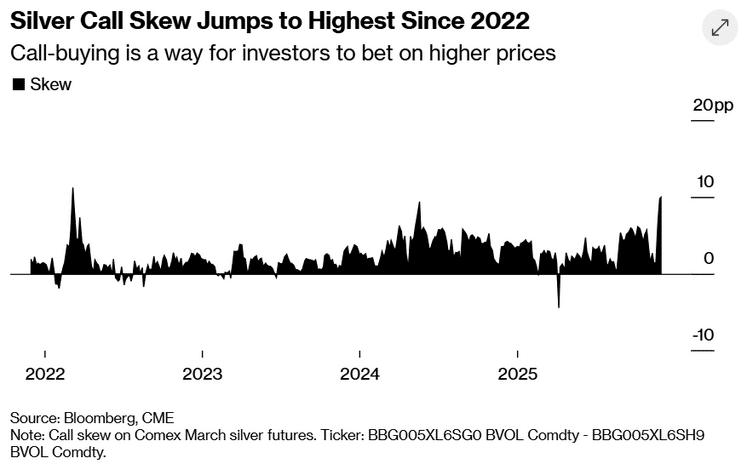
Moreover, call-option premiums have also surged. Silver skew jumped to its highest level since March 2022, indicating that bullish bets are becoming increasingly expensive. This surge in positioning signals growing conviction that silver’s breakout is more than just a speculative spike
On the other hand, rate cut expectations are also fuelling the silver surge. Markets are pricing in an 86% chance of a 25 basis point cut at the Fed’s December 10 meeting.
This follows weak U.S. jobs data and delayed economic releases after the recent government shutdown. Moreover, President Trump’s push for a dovish Fed chair further supports this backdrop.
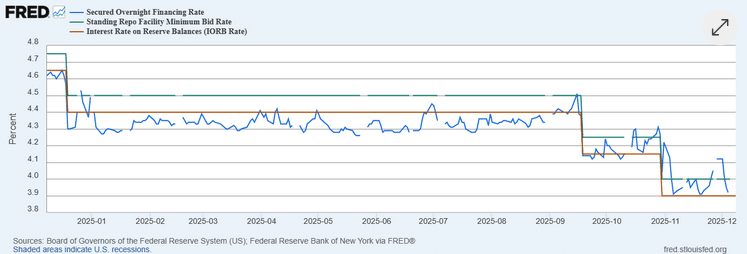
In November, the Secured Overnight Financing Rate (SOFR) briefly spiked to 4.10%. It increased above the Fed’s standing repo rate of 4.00%, signaling short-term funding stress. Although SOFR has since retreated to around 3.90%, the earlier dislocation added a layer of volatility. This volatility supported precious metals.
Supply Deficits and Geopolitical Risks Add Structural Tailwinds
Moreover, structural supply constraints are also driving prices. Despite a record flow of silver into London in October to alleviate shortages, inventories in that region increased. However, inventories in China’s Shanghai Futures Exchange have dropped to decade lows. Borrowing costs for physical silver remain high, underscoring tight market conditions.
Furthermore, silver has been in a supply deficit for five consecutive years. Industrial demand from solar panels, EVs, and medical technology continues to outpace mine output. The chart below shows that the solar power market is projected to reach $495.12 billion by 2034. This projected growth in solar PV demand indicates a significant surge in silver demand.
The market is also responding to geopolitical shifts. After silver was added to the U.S. critical minerals list, traders began to fear possible export tariffs. This has created hesitancy among suppliers and added a geopolitical premium to prices. It suggests that silver’s rally is no longer solely driven by safe-haven flows. It reflects long-term scarcity, accelerating industrial demand, and a macro environment that continues to support higher inflation.
These macro forces collectively support a bullish outlook for silver into early 2026. ETF demand, dovish policy, and tightening physical markets are converging at a time when silver’s role as money and metal is more relevant than ever
Silver Technical Breakout Signals $100 Surge
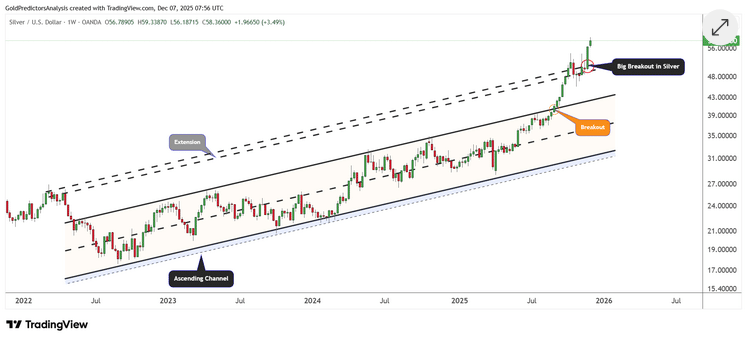
Despite strong macro support, silver’s price action also reinforces the bullish view. The metal has staged a powerful breakout from a two-year ascending channel, confirming a new leg higher.
After consolidating between $50 and $55 in late October, prices surged above the upper boundary of the long-term channel and are now extending beyond $58. Silver broke above the black dotted trendline on Friday, which marks the extension line of the ascending channel pattern. This breakout pushed the price to a new all-time high of $59.33 per ounce.
The weekly candles show strong momentum, limited pullbacks, and rising volume. The price remains well above all major moving averages, and the structure now targets the psychological $62 level next.
Moreover, the monthly chart for silver shows that the price is breaking a long-term resistance at $50-$55 pivotal zone. This breakout indicates a potential push in silver prices toward $100.
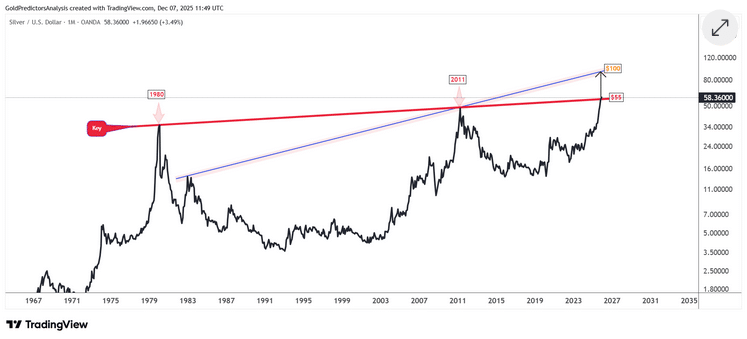
Based on these studies, momentum in the silver market is accelerating. Despite seasonal weakness, prices are producing new highs, indicating that a break above $59.33 could trigger a strong surge toward $62 in the short term. Moreover, a break above $62 will open the door towards the $100 level.
Read the full article HERE.
Decision comes as labor market shows weakness with 1.17M layoffs announced through November, highest since 2020
Federal Reserve policymakers are expected to cut interest rates at this week’s meeting despite inflation remaining above their target amid concerns about a softening labor market.
The Federal Open Market Committee (FOMC), the central bank’s monetary policy-setting committee, will announce its interest rate decision on Wednesday. Markets widely expect a 25-basis-point interest rate cut, which would mark the third straight meeting with a rate cut – though expectations have shifted over time.
Minutes from the FOMC’s last meeting showed deep divides among policymakers over whether a rate cut would be appropriate in December as they look to gradually bring interest rates to a neutral level, with some expressing concerns about the impact that cutting rates at this time could have on inflation.
The market’s expectations for a rate cut at this week’s meeting have shifted wildly amid those concerns and disruptions in the release of economic data. The CME FedWatch tool showed a 30% probability of a rate cut on Nov. 19, down from 98% a month before, as skepticism prevailed. Those odds have rebounded to 87% as of Dec. 5 amid soft labor market data.
A report from global outplacement firm Challenger, Gray & Christmas found that layoffs announced in 2025 through the month of November totaled 1,170,821 cuts – the highest level for a comparable period since 2020, when there were 2,227,725 cuts announced amid the COVID-19 pandemic.
ADP’s jobs report showed the private sector unexpectedly lost 32,000 jobs in November, with 120,000 job losses among small businesses outpacing the modest gains by larger firms.
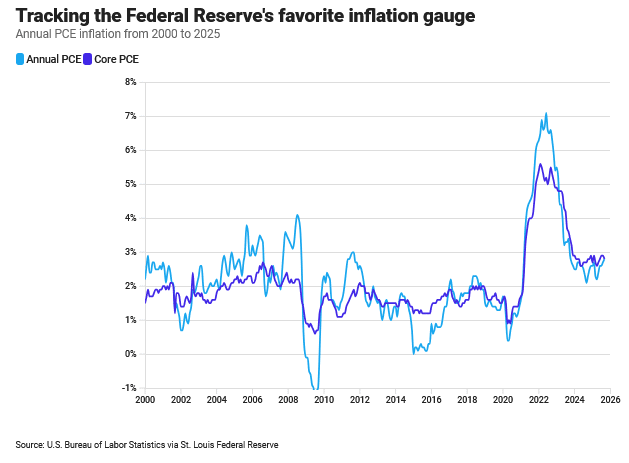
The weak labor market data comes as the Fed’s preferred inflation gauge, the personal consumption expenditures (PCE) index, remained elevated at 2.8% for headline PCE and 2.9% for core PCE in September, which is the most recent data release for the metric due to the effects of the government shutdown on data collection.
Gregory Daco, chief economist at EY-Parthenon, said in a note that policymakers are confronted with three questions entering this meeting: how persistent will tariff-driven inflation be, how weak is the labor market, and how close is monetary policy to neutral.
Daco said that tariff-induced inflation “remains a thorny issue in a new economic paradigm defined by overlapping supply shocks from trade policy and tariffs to demographic shifts, immigration swings, and an emerging technological revolution in AI.”
He noted that the firm projects core PCE inflation will rise to about 3.2% in early 2026 before declining to around 2.3% by the end of next year. Daco added that assessing the labor market is difficult, given sharply lower immigration and an aging population, though he pointed to signs of weakness.
“Most indicators now point to a soft labor market after two years of deterioration illustrated by the rise in unemployment, a hiring rate at its lowest level in a decade, increasing continuing claims, elevated layoff announcements, and job cuts among small businesses,” Daco wrote.
Michael Feroli, chief U.S. economist at JPMorgan, said in a note that heading into the policy meeting there are “almost equally compelling reasons to cut and to hold” and that the ultimate decision will come down to vote-counting.
“Most governors appear to favor cutting, and most reserve bank presidents appear to favor holding. The most decisive news to tilt the balance was NY Fed President Williams’ remarks two weeks ago that there is room for another cut ‘in the near term,'” Feroli wrote.
He added that there may be a “hawkish” tone that accompanies a cut announcement by hinting that the Fed could pause rate cuts at the January policy meeting.
Feroli noted that the firm is anticipating at least two dissents in favor of no rate cut as well as one in favor of a larger rate cut.
Read the full story HERE.
After a year that reshaped global perceptions of gold, the World Gold Council explores the various possibilities for the yellow metal heading into 2026.
Investors should brace for continued economic uncertainty and financial market volatility in 2026, the World Gold Council (WGC) warns in its 2026 outlook — and those circumstances could have various effects on gold.
After a blistering 2025 that has so far seen the yellow metal hit more than 50 all-time highs and rise over 60 percent, the WGC says 2026 could deliver anything from a modest rally to a steep pullback.
The year was a contest between bullish forces tied to slowing global growth and persistent political instability, and bearish pressures that could emerge if the Trump administration successfully lifts US economic performance.
For now, the WGC says the gold price “broadly reflects macroeconomic consensus expectations,” suggesting it could remain rangebound, although factors like softer growth and geopolitical turmoil are likely to provide support.
Read on for the WGC’s 2025 takeaways and its gold outlook for 2026.
2025: A year that redefined gold’s appeal
2025 is shaping up to be gold’s fourth strongest year since 1971, when the gold standard ended.
The WGC notes in its report that investment demand has accelerated across major regions, and central banks have also continued to add to reserves at levels far above historical averages.
Its long-term performance has caught even more attention. New market data shows gold has climbed 953.78 percent over the last three decades, surpassing the S&P 500’s (INDEXSP:.INX) 918.15 percent gain over the same period.
The symbolic victory is fueling renewed interest from investors who once dismissed bullion.
The case for strategic exposure has been reinforced by the metal’s resilience during market stress. Gold saw powerful rallies after the dot-com crash and again during the 2008 financial crisis. It smashed records in 2011, and now in 2025 it is trading near US$4,238 per ounce heading into the end of the year.
3 potential paths for gold in 2026
The WGC’s outlook sets out three primary macroeconomic paths that gold could follow next year: a moderate slowdown, a deep global downturn or a reflationary growth outcome tied to US policy success.
Scenario 1: A shallow slip, moderately bullish for gold
If economic momentum cools — particularly in the US labor market — without collapsing outright, investors may rotate further into defensive assets. A pullback in artificial intelligence stocks could intensify market volatility, while softer consumer activity would put more pressure on policymakers to continue loosening monetary settings.
In this environment, the WGC says gold could gain 5 to 15 percent. Lower rates and a softer dollar would help, as would ongoing central bank buying and potential new flows from large institutional investors in Asia.
Scenario 2: The “doom loop,” strongly bullish for gold
A darker outcome is also on the table: a synchronized global downturn triggered by escalating geopolitical flashpoints or trade fragmentation. As confidence falls and economies contract, the US Federal Reserve could be forced into deep rate cuts while capital floods into safe havens. The WGC estimates gold could advance 15 to 30 percent under such conditions, powered largely by strong investment demand through gold-backed exchange-traded funds.
The WGC notes that exchange-traded fund holdings have risen by more than 700 metric tons this year. Even including inflows going back to mid-2024, the total remains less than half of what was seen in earlier bull cycles.
Scenario 3: Reflation returns, bearish for gold
There is also a non-negligible possibility that US President Donald Trump’s fiscal and industrial policies could spark stronger-than-expected growth. In that case, inflation pressures could push the Fed to keep rates elevated, or even raise them again, sending the US dollar higher and dampening gold investment appeal.
In this upside-growth scenario, the WGC projects a 5 to 20 percent drop in the gold price as investors unwind hedges and rotate into stocks and higher-yielding assets.
US policy looms large over 2026
A major swing factor for gold is Trump’s expected nomination of a Fed chair who favors lower rates.
At the same time, geopolitical risks tied to US actions have been growing.
The administration’s more aggressive posture toward Venezuela and heightened tensions involving China and Russia are adding risk premiums across commodities and supply chains.
These dynamics continue to push global investors toward gold when uncertainty peaks.
The Fed’s near-term decisions will remain crucial. Markets are currently pricing a high probability of additional rate cuts, even as inflation remains a concern. Each shift in those expectations is likely to reverberate through gold pricing.
Gold market wildcards
The WGC also takes note of two supply/demand forces that sit somewhat outside typical quantitative models, but could shape outcomes significantly: official sector buying and recycling flows.
Central banks remain one of the largest gold demand pillars. Purchases have consistently exceeded pre-pandemic levels, in part because emerging market governments are diversifying away from dollar-exposed reserves.
Gold recycling is another overlooked lever. Despite soaring prices, secondary supply has been muted in 2025, partly because gold is increasingly being used as collateral. If a severe downturn forces liquidations of gold-backed debt, recycling flows could climb sharply, adding pressure to prices.
Read the full article HERE.
Key Points
- Conflicting economic signals, including strong services growth but contracting employment, complicate the Federal Reserve’s upcoming rate decision.
- The Institute for Supply Management reported services sector expansion in November, while employment in services contracted for the sixth consecutive month.
- Investors anticipate a quarter-percentage-point Fed rate reduction next week, but concerns about consumer spending and a weakening job market persist.
Investors are getting mixed messages on health of the U.S. economy, leaving stocks in limbo ahead of next week’s Federal Reserve rate decision.
After being powered by the artificial-intelligence trade all year, stocks don’t seem to know where to head this month—traditionally one of the market’s strongest—thanks to data showing solid gains in some corners of the world’s biggest economy, and ongoing weakness in others.
Those conflicting signals are playing havoc with bets on how the Fed will proceed at next week’s rate-setting meeting—and how markets will react later this month once official economic data start filling in the blanks left by the government shutdown.
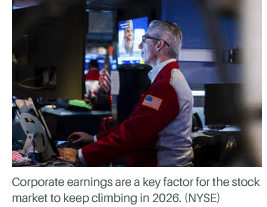
Lower Fed interest rates would almost surely support market valuations over the months ahead. But lukewarm jobs data and retailers’ shaky consumer outlooks could chip away at Wall Street’s projections for corporate earnings growth, which is key to the market’s
“Consumption isn’t just one of many factors in GDP … it is the factor, accounting for nearly 70% of all economic activity,” said Mark Malek, CIO at Siebert Financial.
“When the consumer wobbles, the economy wobbles. When the consumer spends, companies breathe. When the consumer tightens up, markets eventually follow,” he added.
That’s why the recent spate of economic data has been so vexing for Wall Street.
The Institute for Supply Management’s benchmark reading of activity around the services sector, the economy’s primary growth driver, expanded in November at the fastest pace since February, according to data released Wednesday. Input prices fell the most since March 2024—another positive for the sector.
Employment in services, however, contracted for a sixth consecutive month—echoing the weakness seen in payroll processing group ADP’s November employment report.
The ADP reading showed a net decline of 32,000 private sector jobs last month. In addition, wage gains for both workers remaining in their roles and those switching positions slowed notably from last year’s levels.
The official tally of U.S. job gains from the Bureau of Labor Statistics, usually published on the first Friday of each month, is delayed until Dec. 16 because of delays in collecting and processing data during the government shutdown.
The Bureau of Economic Analysis will publish official spending and inflation data on Friday, but the delayed report will only be comprised of data collected for September.
That leaves the Fed to focus on its own internal readings, ADP and other private sector readings, and anecdotal data, to calibrate both its Dec. 10 rate decision and its forecasts for near-term growth, inflation, and unemployment.
The CME Group’s FedWatch tool suggests markets are clearly anticipating a quarter-percentage-point reduction next week, but remain split as to how the central bank will signal its policy path into next year.
“Our expectation is that the doves will win out and we will see a number of rate cuts next year, but potentially fewer than are currently being forecast,” said Chris Zaccarelli, CIO at Northlight Asset Management.
Looser monetary policy could prove crucial for stocks. While the market has been powered by the artificial-intelligence trade, it also needs solid corporate earnings expansion over the whole of 2026 to justify the historically expensive valuations in nearly every sector of the S&P 500.
LSEG data suggest investors see collective profits for the benchmark rising 14.6% next year, with this year’s rate likely to climb to 13% once the fourth-quarter reporting season concludes in early March.
If the 2026 forecast is sound, aggregate earnings will rise to $309.28 a share. Wall Street’s biggest banks and investment groups, meanwhile, project the S&P 500 rising to around 7600 points by the end of 2026, based on forecasts collected by Barron’s. The benchmark index closed at 6850 points on Wednesday.
That would peg the S&P 500’s price-to-earnings ratio at 24.5 times, well north of the 10-year moving average of around 20 and above its current 23 times.
However, those earnings forecasts could be tested by a cautious consumer and a weakening job market—particularly if inflation pressures remain embedded in an economy that is already dealing with the highest nominal prices for food and energy in a generation.
“Earnings will do the heavy lifting next year,” said Savita Subramanian, Bank of America’s head of U.S. equity & quantitative strategy, who forecasts the S&P 500 finishing only at around 7100 points by the end of 2026.
“But we also worry about the tension between AI taking jobs verus consumption remaining resilient in 2026,” Subramanian added.
Some of the early signals on that front aren’t encouraging. Macy’s cautioned investors Wednesday that it’s expecting soft demand from low-income customers over the holiday season.
That view was also reflected in discount retailer Dollar Tree’s better-than-expected current-quarter outlook and Walmart stock’s record high close on Wednesday. Walmart holds a commanding lead in the middle-income market while taking an increasing share of more affluent consumers’ spending; its stock rally reflects investors’ bet that consumers will stay focused on value over discretionary spending.
Stocks are still within a whisker of their all-time highs. The combination of Fed rate cuts, the AI investment boom, and the tax and spending benefits from the One Big Beautiful Bill Act are expected to carry markets higher into next year.
Repeating the market’s recent run of near 20% annual gains, however, will be a lot tougher sledding with rising unemployment and shoppers’ increased caution.
“There’s plenty of concern right now for the state of the U.S. consumer,” said Bret Kenwell, U.S. investment analyst at eToro.
“While this group has buoyed the economy over the last few years, persistent inflation, falling confidence, and a cooling labor market has investors anxious that consumers can continue to shoulder such a heavy load.”
Read the full article HERE.
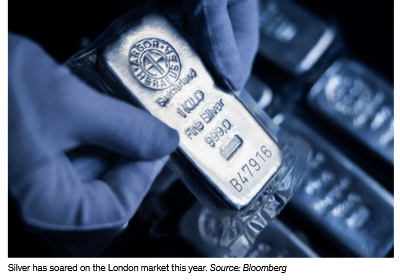
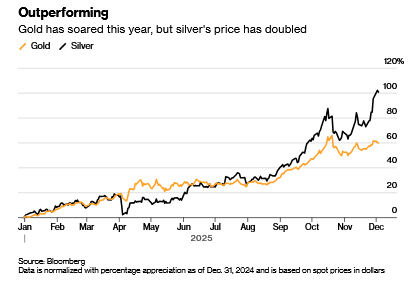
Gold has staged a dramatic rally this year as the US Trump administration’s unorthodox economic policies sent investors and central banks reaching for safe-haven assets. Right now, however, it’s silver that’s stealing the spotlight.
A squeeze in supply of the precious metal had catapulted it to a 100% gain as of early December, while gold was up 60%. Both have been experiencing a surge in demand from investors seeking to hedge against political turbulence, inflation and currency weakness.
Unlike gold, silver isn’t just scarce and beautiful: It also has many useful real-world properties that make it a valuable component in a range of products. With inventories near their lowest on record and investors still scrambling for more, there’s a risk of supply shortages that could impact multiple industries.
Who needs silver?
Silver is an excellent electrical conductor that’s used in circuit boards and switches, electric vehicles and batteries. Silver paste is a critical ingredient in solar panels, and the metal is also used in coatings for medical devices. Sustained high prices could erode the profitability of industrial users and spur efforts to substitute silver components for other metals.
Like gold, silver is still a popular ingredient for making jewelry and coins. China and India remain the top buyers of silver, thanks to their vast industrial bases, large populations and the important role that silver jewelry continues to play as a store of value passed down the generations.
Governments and mints also consume large quantities of silver to produce bullion coins and other products. As a tradable asset, it’s much cheaper than gold per ounce, making it more accessible to retail investors, and its price tends to move more sharply during precious metal rallies.
What makes the silver market unique?
Silver’s varied uses mean its market price is influenced by a wide array of events including shifts in manufacturing cycles and interest rates and even renewable energy policy. When the global economy accelerates, industrial demand tends to push silver higher. When recessions loom, investors can step in as alternative buyers.
The market is thinner than with gold. Daily turnover is smaller, inventories are tighter and liquidity can evaporate quickly. The silver stored in London is worth just shy of $50 billion, while the gold is worth $1.2 trillion, though much of both are not available to borrow or buy for investors. For gold, the London market is underpinned by around $700 billion of bullion held mostly by the world’s central banks in vaults of the Bank of England. This can be lent out when a liquidity squeeze hits, effectively making the central banks lenders of last resort — but no such reserve exists for silver.
Why has silver rallied so much this year?
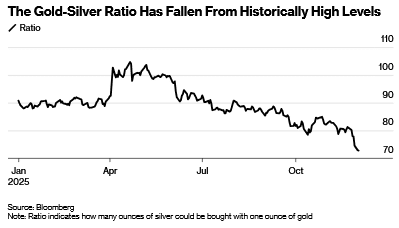
Silver often moves in tandem with gold, but with more violent price moves. After the yellow metal surged in the early months of 2025, some investors pointed to the stretched ratio of prices between the two metals of more than 100-1. Silver’s apparent cheapness relative to gold was enough to encourage some investors to pile into the white metal.
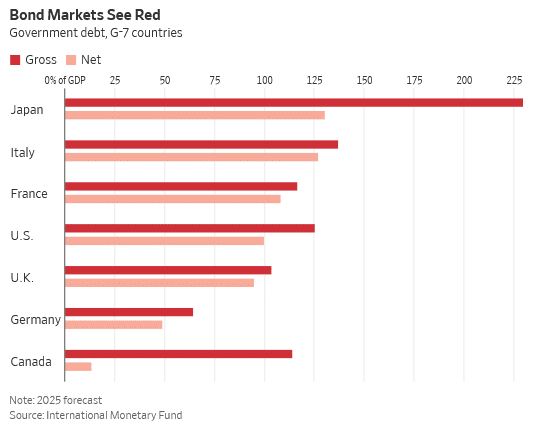
Heavy debt loads in major economies such as the US, France and Japan and a lack of political will to solve them also encouraged some investors to stock up on silver and other alternative assets this year, in a wider retreat from government bonds and currencies dubbed the debasement trade.
Meanwhile, global silver mine output has been constrained by declining ore grades and limited new project development. Mexico, Peru, and China — the top three producers — have all faced setbacks ranging from regulatory hurdles to environmental restrictions.
Global demand for silver has outpaced the output from mines for five consecutive years, while silver-backed exchange-traded funds have drawn in new investment.
What was the silver squeeze that hit the market this year?
Speculation earlier this year that the US would levy tariffs on silver led to a flood of the metal into vaults linked to the Comex commodities exchange in New York, as traders sought to take advantage of premium prices in that market.
That contributed to a dwindling of available silver stocks in London, the dominant spot trading hub. Those stocks were further eroded as more than one hundred million ounces flowed into ETFs backed by physical bullion.
With a spike of demand during the Indian festive season in October, the market suddenly seized up. The cost of borrowing silver surged to a record, while prices jumped.
That tightness pushed London prices above other international benchmarks, helping to ease the squeeze. Traders are still monitoring for any potential US tariff on silver after the precious metal was added to the US Geological Survey’s list of critical minerals in November.
Read the full article HERE.
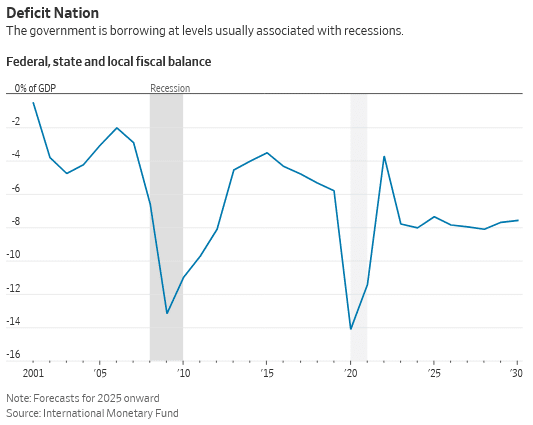
All that stands between the U.S. and a debt-market freakout is the dollar. Having the world’s reserve currency isn’t the unbreakable shield many assume.

Politics and debt don’t mix well. Americans would be wise to look across the Atlantic to see how tough things can get.
The U.K. government demonstrated the problem with its annual budget, where it is stuck in a trilemma, unable to please lenders and voters while also doing the right thing for the economy. Something had to give, so on Wednesday the government ignored its promises to go for growth, and focused on the bond market and its political base.
France has the same trilemma, only worse. Government debt is higher than in the U.K., the fiscal deficit is higher, and not only are tax rises politically impossible but taxes are already so high that raising them further might be self-defeating.
Spending cuts are even more difficult than in Britain—where welfare cuts have proved to be a political nonstarter—and securing a budget at all in a deeply riven French Parliament is a challenge. At least in London the bond panic during the supershort term of Prime Minister Liz Truss has shown the politicians that they have to pay attention to lenders.
Already some of the same issues are visible in the U.S.—along with a lack of political will to do anything to prevent the problem from festering. For now, all that stands between the U.S. and a debt-market freakout is the dollar. Having the world’s reserve currency, however, isn’t the unbreakable shield many assume.
Go back to the U.K. to see how dysfunctional politics limits action. The government floated the idea of an economically efficient income-tax rise in the run-up to the budget, and the bond market loved it. But politics made Chancellor of the Exchequer Rachel Reeves abandon the idea in favor of a series of smaller, delayed tax rises on pensions, corporate investment and driving that each slice a little off potential growth—but, she hopes, will get less attention from voters. The money raised goes into welfare spending forced on the government by its own members of Parliament, after it lost a fight earlier this year.
The parallel issue in the U.S. is tariffs: An inefficient tax on the purchase of certain foreign goods is possible (though the legality of the biggest tariffs is still to be determined), and even briefly popular. But U.S. politics is just as fragile as in the U.K., and when the bond market or voters objected, tariffs have been rolled back.
April’s so-called reciprocal tariffs were delayed and then slashed when the bond market panicked. They dropped from a peak effective rate of 28% to the current 18% calculated by the nonpartisan Budget Lab at Yale—far lower, although still the highest since 1934.
Likewise, rising voter concern about food prices has led to tariffs on imports of coffee, bananas and some beef being ditched. It was sensible to remove those, but it was especially bizarre to introduce charges on foodstuffs not even produced in the U.S. in the first place.
The U.S. doesn’t yet have the trilemma created by conflicting demands on tax, spending and borrowing, thanks to global demand for dollars funneling money into Treasurys. But there are worrying signs, and the fiscal situation suggests a growing chance of trouble ahead—despite faster economic growth than elsewhere.
Warnings of bond pressure have shown up in extreme situations. Most recent was the April revolt, where 10-year Treasury yields jumped and concern grew about a self-fulfilling liquidation of borrowing, akin to the U.K.’s Truss moment, before President Trump pulled back. In 2020, lockdowns showed how bad such a selling spiral can be, and the Federal Reserve was forced to buy more than $1 trillion of bonds to stabilize the market.
The fiscal situation in the U.S. is far worse than what Reeves has to deal with in Britain. The International Monetary Fund estimates that total U.K. government debt will hit 95% of gross domestic product this year, with a deficit of 4.3%. U.S. debt is expected to be a smidgen below 100%, with a deficit on course to be one of the biggest in the developed world at more than 7%.
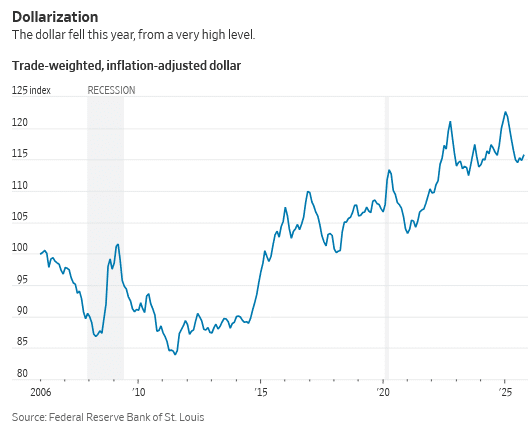
What saves American finance is the dollar’s status as the must-have global asset and trading currency. Both roles face challenges, though, and the more the U.S. exploits foreigners, the higher the risk they look elsewhere.
There are four overlapping threats to the dollar: supply, China, reserve safety and the pushing away of allies.
Supply is the big one, as the U.S. runs near-record peacetime deficits on top of a bulging current-account deficit. America has to attract a constant flow of foreign capital to finance government and imports, an unstable position.
China has shifted a little more trade into yuan, although the dollar remains by far the dominant currency for international payments. China, Russia and others including Turkey have been replacing some of their reserves with gold in the midst of rising concern about dollar-based reserves being frozen or confiscated by Washington. And while allied governments haven’t obviously cut their dollar exposure, they were spooked by Trump’s tariffs and talk of unilateral fees on reserves held in Treasurys.
None of these has, so far, dealt significant damage to the dollar’s reserve status. But they all hurt. The risk is that the market senses a shift coming and pushes up Treasury yields in anticipation of foreign buyers drifting away.
On the plus side, it is economically easy for the U.S. to head off the problem. It raises the lowest tax as a share of GDP of any Group of Seven country, at just 30%, so higher taxes are likely to damage growth less than elsewhere. Government spending, also the lowest in the G-7, is harder to cut, as the failure of Elon Musk’s Department of Government Efficiency demonstrated.
If the problem sounds familiar, it should be. Former Luxembourg Prime Minister and European Commission President Jean-Claude Juncker once said: “We all know what to do, we just don’t know how to get re-elected after we’ve done it.”
It isn’t clear that today’s politicians do, in fact, know what to do. But whether they know or not, getting re-elected while staying within the strictures of the bond market is going to be tough. America has the dollar to lean on—but probably not forever.
Read the full article HERE.
The U.S. dollar slid on Tuesday as a slew of mixed economic data, some delayed and therefore dated, reinforced expectations that the Federal Reserve will cut interest rates next month.
The euro was last up 0.40% against the dollar at $1.1566, while sterling gained 0.45% to $1.3162.
The dollar index, a measure of its performance against its major counterparts, fell 0.31% to 99.83 following the release of September retail sales and producer price data, after it initially held on to its gains from last week when the index rose nearly 1%.
“Producer prices were stable and retail sales showed a modest consumer slowdown, and this keeps a December rate cut on the table,” said Scott Helfstein, head of investment strategy, at Global X, in emailed comments.
Data showed U.S. retail sales rose 0.2% in September, less than 0.4% forecast by economists polled by Reuters and slowing from an unrevised 0.6% gain in August.
Producer prices, on the other hand, increased 0.3%, in line with expectation, after an unrevised 0.1% drop in August; however, at the core level prices inched up 0.1%, below the consensus forecast of 0.2%.
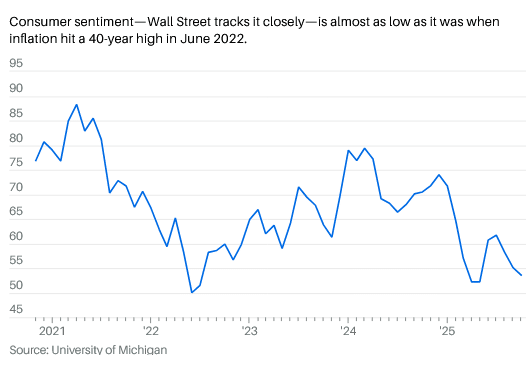
In addition, the latest U.S. consumer confidence number declined to 88.7 in November, from an upwardly revised 95.5 in October, which further hurt dollar sentiment. Economists polled by Reuters had forecast the index edging down to 93.4 from the previously reported 94.6 in October.
“More worries about what lies ahead … hence, putting purchases for major items on hold,” wrote Jennifer Lee, senior economist at BMO in emailed comments.
The economic data followed dovish comments from policymakers in the past few days that helped cement rate cut expectations.
On Monday, Fed Governor Christopher Waller said the job market was weak enough to warrant another quarter-point rate cut in December, though action beyond that depended on a flood of data that was delayed by the federal government shutdown.
Waller’s comments followed similar remarks by New York Fed President John Williams on Friday.
Traders are now pricing in an 83% chance of a cut next month, up from 50% a week earlier, CME FedWatch showed. That huge swing underscores the challenge the market faces in pricing in near-term rates in the absence of economic data caused by the longest-ever U.S. government shutdown, which ended on November 14.
Francesco Pesole, currency analyst at ING, said some “year-end rebalancing flows before Thanksgiving may be getting in the way” of dollar weakening.
However, he added in a note to clients, “unless markets have a hawkish rethink, the dollar looks too strong relative to short-term rate differentials at these levels, and we see some material downside risks.”
In other currency pairs, the yen, which has been on the defensive since hitting 10-month lows last week, firmed on Tuesday to 156.09 per dollar, leaving the dollar down 0.51% against the Japanese currency.
Investors have been waiting for any signs of official buying from Tokyo to support its currency, which has weakened by nearly 10 yen since the start of October after fiscal dove Sanae Takaichi took over as Japan’s prime minister.
Pesole said thinner liquidity around Thanksgiving could present good conditions for the Bank of Japan to intervene in USD/JPY, ideally after a market-driven correction in the pair.
Read the full article HERE.
Key Points:
- Retail sales increased by 0.2% in September, falling short of the 0.4% forecast by economists.
- Excluding vehicles, parts, and gasoline, retail sales rose by 0.1%, also below the 0.4% forecast.
- Consumer spending growth slowed, particularly for discretionary purchases, due to economic uncertainty.
The first glimpse of official consumer spending data in two months is in: retail sales rose at a slower pace than expected in September.
Retail sales increased at a monthly pace of 0.2% from August to September. Economists polled by FactSet were expecting a 0.4% jump. Sales rose 0.6% in August from July.
Stripping out sales of vehicles, car parts, and gasoline, retail sales rose just 0.1%, below forecasts for a 0.4% increase.
The report was delayed because of the 43-day government shutdown, which ended mid-November. While the September data may be a bit “stale” this close to the end of the year, the results nonetheless provide insights about the health of U.S. consumers heading into the all-important holiday season.
The main takeaway is that while spending is resilient, growth slowed toward the end of the summer—particularly for discretionary purchases—as economic uncertainty weighs on consumers. Of the 13 categories that the Census Bureau tracks, five recorded monthly decreases in sales: sporting goods, hobby, instrument, and book stores; clothing and accessories stores, nonstore retailers, electronics and appliance stores, and motor vehicle and parts dealers.
“With wage growth slowing and tariffs now fully in place, we think higher prices will start to weigh on consumption,” wrote Michael Reid, senior U.S. economist at RBC Economics, ahead of the report.
Last week, many big-box retailers reported fiscal third-quarter earnings. The results were a mixed bag, with some topping analysts’ earnings expectations and others falling short. But given the dearth of official spending data, investors were more eager to hear what they had to say about the consumer economy.
The main takeaways are that Americans are selective in their spending and are prioritizing value as concerns over inflation and affordability mount among lower- and middle-income consumers.
Home Deport CEO Ted Decker said on Tuesday that macroeconomic pressures had hampered the home improvement market’s expected recovery in the third quarter.
“We were expecting interest rates and mortgage rates to come down, which they did, that would have been some assistance to housing,” Decker said. “But we really just saw ongoing consumer uncertainty and pressure in housing that are disproportionately impacting home improvement demand.”
Target’s Chief Commercial Officer Rick Gomez followed up on Wednesday saying that consumers remained cautious approaching the holiday season, with consumer sentiment ranging at three-year lows.
“Guests are choiceful, stretching budgets and prioritizing value,” he said. “They’re spending where it matters most, especially in food, essentials, and beauty, while looking for trend-right deals in discretionary categories.”
Retailers also flagged that spending had been slightly affected by the closure of the federal government—a fact that won’t be reflected until October and November’s data. The Census Bureau has yet to set a date for both releases.
Most official government releases have been pushed back or canceled altogether—a fact that has complicated matters for investors, economists, and policymakers.
The September data will likely provide Federal Reserve officials additional information as they decide whether to cut interest rates or not at their meeting in December. But unfortunately for the Fed, the timelier releases won’t come until after, Reid added.
Read the full article HERE.

Albert Edwards, the outspoken Global Strategist at Société Générale—a figure who even refers to himself as a “perma bear”—is certain that the current U.S. equity market, driven largely by high-flying tech and AI, is experiencing a dangerous bubble. (Société Générale, to be clear, does not hold the view that U.S. stocks or AI stocks are in a bubble, noting that Edwards is employed as the in-house alternative view.) While history often repeats itself, Edwards warned recently that the circumstances surrounding this cycle’s inevitable collapse are fundamentally different, potentially leading to a deeper and more painful reckoning for the economy and the average investor.
“I think there’s a bubble but there again I always think there’s a bubble,” Edwards told Bloomberg’s Merryn Somerset Webb in a recent appearance on her podcast Merryn Talks Money, noting that during each cycle, there is always a “very plausible narrative, very compelling.” However, he was unwavering in his conclusion: “it will end in tears, that much I’m sure of.”
Edwards told Fortune in an interview that previous theories about a bubble were “very convincing in 1999 and early 2000, they were very convincing in 2006-2007.” Each time, he said, the “surge in the market was so relentless” that he just stopped talking about bubbles, “because clients get pissed off with you repeating the same thing over and over again and being wrong,” only to change their tune after the bubble bursts. “Generally, when you’re gripped by a bubble, people just don’t want to listen because they’re making so much money.”
As he himself frequently points out, Edwards is known as a very bearish market strategist who has made some high-profile and dramatic predictions, often warning about major stock market crashes and recessions. His track record includes famously calling the dot-com bubble, but it also includes warnings that haven’t panned out, such as predicting a potential 75% drop in the S&P 500 from peaks—worse than the 2008 financial crisis lows. When The New York Times profiled Edwards in 2010, they noted that the chuckling, birkenstocks-wearing analyst had been predicting a Japan-style stagnation for U.S. equity markets since 1997 (a prediction he repeated in his interview with Fortune).
Still, Edwards insists that the current parallels to the late 1990s NASDAQ bubble are clear: extremely rich valuations in tech, with some U.S. companies trading at over 30x forward earnings, justified by compelling growth narratives. Just as the TMT (Technology, Media, Telecom) sector attracted vast, sometimes wasted, capital investment in the 1990s, Edwards argued that today’s enthusiasm echoes that earlier era. There are two key differences that could lead to a much worse outcome this time, though.
The Missing Trigger and the Meltup Risk
In previous cycles, Edwards explained, the catalyst for a bubble’s demise was usually the monetary authority’s tightening cycle—the Federal Reserve hiking rates and exposing market froth. This time, with the Fed lowering rates, that trigger is conspicuously absent. Bank of America Research has noted the rarity of central banks cutting rates amid rising inflation, which has occurred just 16% of the time since 1973. Ominously, BofA released a note on the “Ghosts of 2007” in August.
Instead of tightening, Edwards anticipates the Fed will move away from quantitative tightening and likely shift to quantitative easing “quite soon,” due to issues in the U.S. repo markets, another ghost from the Great Recession. The Fed itself issued a staff report in 2021 on repo issues, writing in 2021 that trading between 2007 and 2009 “highlighted important vulnerabilities of the US repo market.” Repo issues reemerged in the pandemic, with the Richmond Fed noting that interest rates “spiked dramatically higher” starting in 2019.
Edwards told Bloomberg that the absence of hawkish policy could lead to a “further meltup,” making the eventual burst even more damaging. Poking fun at himself, Edwards said, “I just got bored being bearish, basically rattling my chains saying, ‘This is all a bubble, it’s all going to collapse.’” He said that he can see how the bubble can actually keep going for much longer than a perma bear like himself would find logical, “and actually that’s when something just comes out the woodwork and takes the legs from out from under the bubble.”
“What’s more worrying about the AI bubble,” Edwards told Fortune, “is how much more dependent the economy is on this theme, not just for the business investments, which is driving growth,” but also the fact that consumption growth is being dominated far more than normal by the top quintile. In other words, the richest Americans who are heavily invested in equities, are driving more of the economy than during previous bubbles, accounting for a much larger proportion of consumption. “So the economy, if you like, is more vulnerable than it was in the ’87 crash,” Edwards explained, with a 25% or greater correction in stocks meaning that consumer spending will surely suffer—let alone a 50% lurch.
Edwards told Bloomberg he was concerned about the widespread participation of retail investors who have been dragged into the market, encouraged to “just buy the dips.” This belief that “the stock market never goes down” is dangerous, Edwards warned, arguing that a 30% or even a 50% decline is very possible. The inequality of American society and the heavy concentration among high earners whose wealth has been “inflated by the stock market” is a major concern for Edwards, who pointed out that if there is a major stock-market correction, then U.S. consumption will be “hit very, very badly indeed” and the entire economy will suffer. This view is increasingly shared by less uber-bearish voices on Wall Street, such as Morgan Stanley Wealth Management’s Lisa Shalett.
In many ways, Edwards told Fortune, we’re overdue for a correction, noting that apart from two months during the pandemic, there hasn’t been a recession since 2008. “That’s a bloody long time, and the business cycle eventually always goes into recession.” He said it’s been so long that his perma-bear instincts are confused. “The fact I’m less worried about an imminent collapse [right now] makes me worried,” Edwards added with a laugh.
Edwards told Fortune that he’s been through various cycles and bubbles and he gained his perma-bear status in the mid-1990s, when he felt a distant earthquake happening in Asia. “You’ve been around the block a few times, you just do become cynical,” he said, before correcting himself: “That’s not the right word. You become extremely skeptical of the full narrative.” He proudly repeats the story about how, when he was at Dresdner Kleinwort in the ’90s, he wrote with skepticism about Malaysia’s economic boom at the time, only to be surprised when Thailand blew up first. Nevertheless, he said, “we lost all our banking licenses [in Malaysia] because of what I wrote,” adding that the story is still proudly pinned to his X.com account.
“I had to sort of basically hide under my desk,” Edwards said of the inward reception to the emergence of his inner bear. “Corporate finance banking departments certainly didn’t appreciate losing all their banking licenses. But in retrospect, you know, they avoided a final year of lending to Malaysia before it blew up. They didn’t thank me afterwards.”
Fiscal Incontinence and Cockroaches
Beyond equity valuations, Edwards has been highlighting two other major underlying risks point to systemic vulnerability. First, Edwards highlighted the long-term risk of inflation in the West, driven by “fiscal incontinence.” Despite short-term cyclical deflationary pressure emanating from China—which has seen 12 successive quarters of year-on-year declines in its GDP deflator—Edwards said he believes the path of least resistance for highly indebted Western politicians will be “money printing.” At some point, the mathematics for fiscal sustainability “just do not add up,” forcing central banks to intervene through “yield curve control” or quantitative easing to hold down bond yields.
This is where Edwards’ long-held thesis about Japan comes in, what he calls “The Ice Age.” Around 1996, he said, he started thinking that “what’s happening in Japan will come to Europe and the U.S. with a lag.” He explained that the bursting of the Japanese stock bubble led to all kinds of nasty things: real interest rates collapsing, inflation going to zero, bond yields going to zero. Ultimately, it was a period of low growth that Japan still has not been able to break out of. The difference with the U.S., he added, is that Japanification actually started happening in 2000 with the dot-com bubble bursting, but “the relationship broke” between the economy and asset prices as the Fed began “throwing money” at the problem through QE. The U.S. has essentially been in a 25-year bubble since then that is due to burst any day now, he argued—it’s been due any day for a quarter-century.
“We’re going to end up with runaway inflation at some point,” Edwards told Fortune, “because, I mean, that’s the end game, right? There’s no appetite to cut back the deficits. We bring back the QE, if and when this bubble bursts, the only solution is more QE, and then we end up with inflation, maybe even worse than 2022.”
Edwards also sees a smoking gun in home prices. “You look at the U.S. housing market, you think, ‘Well, actually, is the Fed just too loose relative to everywhere else?’ Because why should other housing bubbles have deflated in terms of house price earnings ratio, but the U.S. is still stuck up there at maximum valuation or close to it?” In a flourish that shows why Edwards is so respected despite his broken-record reputation, he notes that in a Bloomberg Opinion piece from 2018, legendary former Fed chair Paul Volcker “eviscerated the Fed just before he died.” The central banker who famously slew inflation in the 1980s argued that the modern era’s loose monetary policy was “a grave error of judgment … basically just kicking the can down the road.” Edwards shared an OECD chart with Fortune to show just how much U.S. housing has decoupled from global markets because the Fed has been too loose.
The analyst also said he applied his skepticism to private equity, an asset class that he sees having benefited immensely from years of falling bond yields and leverage. Private equity’s advantage has been its tax treatment and the fact that “it doesn’t have to mark itself to market, so it isn’t very volatile.” However, the sector is highly leveraged, and if the global environment shifts to a secular bear market for bonds, he said that would be a “major problem.” Recent high-profile bankruptcies have started to leak into bond markets, prompting concern of “credit cockroaches,” as JPMorgan CEO Jamie Dimon recently labeled the issue.
Drawing on the metaphor that “you never have just one cockroach,” Edwards warned that these bankruptcies signal deeper issues in a highly leveraged sector that has spread its “tentacles… deeply into the real economy.”
Fortune notes to Edwards that more mainstream, less bearish voices are sounding similar warnings, Mohamed El-Erian at the Yahoo Finance Invest conference and Jeffrey Gundlach, the “bond king,” who takes a similarly skeptical view of private equity. Edwards agreed that something is in the air. “I would say there are more voices of skepticism. And again, this is one thing which makes me worry. This bubble can go on. If it is a bubble can go on quite a long while. Well, we can kick the can down the road many times. Normally, the skeptics are swept aside.”
For investors trapped between the fear of a collapse and the fear of missing a meltup, Edwards told advised investors to take him with a grain of salt but be mindful of potential warning sings. “I say that I predict a recession every year, don’t listen to me, but these are the things you should be looking out for.” Paraphrasing an infamous quote from former Citi CEO Chuck Prince that summed up the bubble mentality with a metaphor about a dance party, Edwards recommended: “In terms of dancing while the music’s still playing, you have to decide whether to be in front of the band, pogoing, or dancing close to the fire escape, ready to get out first.”
Read the full article HERE.