
JP Morgan analysts on Thursday maintained a bullish outlook on gold, forecasting prices could reach an average of $5,055 per ounce by the fourth quarter of 2026.
The forecast is based on “demand assumptions that see investor demand and central bank buying averaging around 566 tons a quarter in 2026,” the bank said in a note.
“Gold remains our highest conviction long for the year, and we see further upside as the market enters a Fed rate-cutting cycle,” Natasha Kaneva, Head of Global Commodities Strategy at JP Morgan, said.
The combination of a “Fed cutting cycle with overlays of stagflation anxiety, concerns around Fed independence, and broader debasement hedging” supports gold’s upside, Gregory Shearer, Head of Base & Precious Metals Strategy said.
On the dollar, the bank noted that the rally is “not a de-dollarization or not a debasement story, but it is most likely a dollar diversification story,” highlighting that foreign holders of U.S. assets are gradually redirecting small allocations into gold.
JP Morgan analysts also highlighted that recent market consolidation is healthy.
The pullback reflects the market digesting the rapid price gains since August, said Kaneva.
“It’s normal if you’re paralyzed with fear, because the price moved so fast … It’s just a very clean story – you have a lot of buyers, and you have no sellers,” she said.
She reiterated a long-term target of $6,000/oz by 2028, stressing that gold should be viewed on a multi-year horizon.
Spot gold has achieved several record highs this year, with the latest peak of $4,381.21 hit on Monday, marking a significant year-to-date gain of nearly 57% and setting the stage for its strongest annual performance since 1979.
Read the full article HERE.

Wall Street strategists often warn investors that the “stock market is not the economy.” But in 2025, the two feel increasingly intertwined as the surge in artificial intelligence demand has helped buoy both economic growth and stock market gains.
“We believe that AI has kept the economy out of recession,” says BNP Paribas chief U.S. economist James Egelhof.
Research from Egelhof’s economics team shows that AI related investments contributed roughly a quarter of the total gross domestic product (GDP) growth through the first two quarters of 2025.
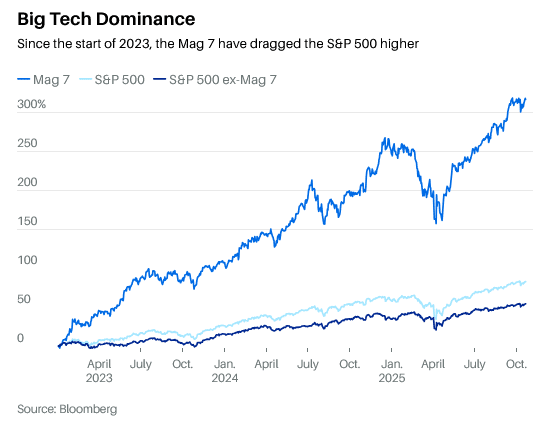
BNP Paribas’ economists note it’s normal for investment in any potential game-changing technology to contribute substantially to GDP. But the concentration risk feels more significant when considering how reliant the stock market rally has become on the AI boom. This year alone a combination of AI stocks—comprised of Apple, Amazon, Alphabet, Broadcom
Palantir, Tesla —have contributed about 58% of the S&P 500’s $7.58 trillion market cap gain.
The market’s most recent leg higher has featured large rallies in stocks driven by the announcements of future AI investments. Large language model leader OpenAI has penciled itself in for $300 billion of cloud computing services from Oracle and taken a stake in AI chip maker AMD. Meanwhile leading AI chip provider Nvidia has invested $100 billion into OpenAI.
“The economy’s fate is inexplicably intertwined with that of AI, so when the investments start looking circular, it’s a concerning sign,” Fundstrat economic strategist Hardika Singh writes in an Oct. 11 note to clients.
Wall Street strategists have largely pegged the path to future gains for the major stock indexes to continued growth in the AI story. In a note to clients that projected the S&P 500 to hit 7,200 by the end of 2026 on Sept. 9, Wells Fargo’s chief equity strategist wrote “[the] music stops when the AI capex stops.”
Investors aren’t the only ones wondering when the AI hype train will suddenly stop. Economists like Egelhof at BNP Paribas are pondering the same question when considering what can go wrong. Egelhof notes the economy is “levered” to AI not just because it’s significantly contributing to GDP. It’s also the reason surging stock markets are filling high-income wallets and boosting consumer spending.
“We tend to think that the economy is more responsive to market valuations than it has been in the past, because of the greater reliance of consumer spending on the higher end consumer than we’ve seen historically, and because that consumer is likely spending in contemplation of their equity market gains,” Egelhof says.
By this logic, a swift unwinding of the AI trade could impact consumer spending and weigh on economic growth. Add in the negative impacts of slowing capital spending from large tech firms, and there’s a clear case GDP could take a hit when the AI bubble bursts.
“If AI does not fulfill on the promises that it has made, then there is economic downside risk,” Egelhof says.
To be sure, Egelhof and others don’t think an AI downturn would clearly mean the legs would fully fall out of the U.S. economic growth story.
“If [AI] rolls out smoothly it shouldn’t cause a recession,” J.P. Morgan Asset Management chief global strategist David Kelly says.
Keep in mind that not all recessions are created equal either. When the dot-com bubble burst in 2000, the subsequent recession “wasn’t huge by historical standards at all,” says Kelly. The unemployment rate moved from 4.3% to 5.5% during that recession. It would rise from 5% to 9.5% during the recession prompted by the Great Financial Crisis.
“The economic impact of that pullback in capital spending on its own may not be that great,” Kelly said. “The real issue is, what does it do for portfolios.”
Read the full article HERE
“Circularity” has become a buzzword in artificial-intelligence deals. Some investors have drawn comparisons between the megadeals of today and some excesses of the original dot-com bubble.
Today the dollars at stake are exponentially bigger, the deals are more complex, and the money trail is often harder to follow. But some similarities are real. One risk: If enthusiasm for spending money on data centers wanes, companies such as Nvidia NVDA -0.55%decrease; red down pointing triangle and Microsoft MSFT 1.11%increase; green up pointing triangle could be hit twice—with less revenue coming in and declining values for their equity investments in customers.
Broadly speaking, circular financing often goes something like this: One company pays money to another as part of a transaction, and then the other company turns around and buys the first company’s products or services. Without the initial transaction, the other company might not be able to make the purchase. The funding mechanism could take the form of an investment, a loan, a lease or something else.
During the late 1990s and early 2000s, such dependency loops mainly consisted of telecom-equipment makers lending money or extending credit to customers so the customers could afford to buy their gear. In those days, this was widely referred to as vendor financing.
The poster child for vendor financing run amok was Lucent Technologies. It lent billions of dollars to upstart telecom providers building out their infrastructure and networks. In the boom years, their purchases helped fuel Lucent’s rapid sales growth. When those customers went bust—because they ran out of cash and couldn’t raise fresh capital—Lucent had to write off their bad debts and book huge losses.
Some of Lucent’s biggest troubled customers, including telecom startup Winstar Communications, were publicly traded. As it turned out, investors sometimes could learn more about Lucent’s doomed vendor-financing deals from reading Winstar’s disclosures than they could from Lucent’s.

Vendor financing still exists. But it isn’t how the bulk of the latest attention-grabbing, circular deals are structured.
Take, for example, the strategic partnership announced in September by Nvidia and OpenAI, the company behind ChatGPT. The companies said Nvidia would invest as much as $100 billion in OpenAI, and that OpenAI is looking to buy millions of Nvidia’s specialized chips. That isn’t vendor financing, because it doesn’t involve a loan to finance a specific purchase. But it does look circular.
OpenAI isn’t publicly traded, so it doesn’t disclose financial reports. But it is known to be losing money, notwithstanding a recent secondary share sale that implied a $500 billion valuation. Nvidia’s investment will help OpenAI pay for its infrastructure build-out. Nvidia also stands to get money back from OpenAI through chip sales, boosting its revenue.
To bullish investors that might look like a win-win. It also provides fodder for skeptics who suspect the AI ecosystem is in a bubble and can’t expand without the companies subsidizing and leaning on each other. The actual deal terms weren’t disclosed, either, because Nvidia and OpenAI said they weren’t finalized. In a vendor-finance deal, the risk for the seller is it won’t get paid. For Nvidia, its OpenAI investment could fall in value, but it also has the chance for upside.
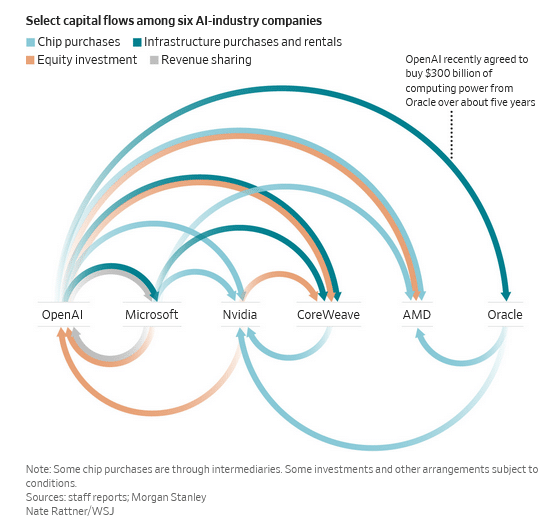
That is a relatively simple example. When Morgan Stanley analysts in an Oct. 8 report mapped out the AI ecosystem to show the capital flows between six companies—OpenAI, Nvidia, Microsoft, Oracle ORCL -0.95%decrease; red down pointing triangle, Advanced Micro Devices AMD -2.93%decrease; red down pointing triangle and CoreWeave CRWV -6.36%decrease; red down pointing triangle—the arrows connecting them resembled a plate of spaghetti.
OpenAI recently agreed to buy $300 billion of computing power from Oracle over about five years. It is far from clear how OpenAI will get all the money, or whether it would still be possible should Nvidia’s $100 billion investment fail to materialize. That in turn could mean Oracle has less money for Nvidia chips.
AMD, a rival to Nvidia, was so eager to land OpenAI as a customer that it issued warrants for OpenAI to buy as much as 10% of AMD at a penny a share. AMD said it expects tens of billions of dollars of revenue, but it’s basically paying OpenAI to become a customer.
CoreWeave, an AI-cloud infrastructure company that rents out data-center capacity, illustrates the industry’s complex ties. Nvidia owns about 5% of CoreWeave and sells chips to CoreWeave. Nvidia also committed to purchase any unsold cloud-computing capacity from CoreWeave through 2032, effectively backstopping its customer.
Meanwhile, CoreWeave’s biggest customer is Microsoft, which is an investor in OpenAI, shares revenue with OpenAI, buys chips from Nvidia and has partnerships with AMD. OpenAI also is a CoreWeave customer and shareholder, having made a $350 million equity investment in the company before its initial public offering.
Anyone trying to keep track of all the relationships would have a hard time. CoreWeave also has disclosed having some vendor-financing debt, but not the identity of the counterparty.
There isn’t necessarily anything untoward about these arrangements. AI is a transformational technology, and OpenAI is a juggernaut. The industry’s participants are in a race to build the infrastructure they need quickly.
Their efforts may pay off enormously if OpenAI and its competitors can ultimately generate strong cash flows to justify all the capital spending. But there also could come a point when investors grow tired of companies pouring so much capital into developing AI models and products, with little visibility into future returns.
That is when the AI ecosystem conceivably could hit a wall, and where the parallels may lie with the original internet bubble and the circular deals of that era. Circularity can be virtuous on the upside, and vicious on the downside. The deals can work fine, until they don’t.
Read the full article HERE.
- The idea of a “neutral” rate of interest is unhelpful in setting monetary policy due to its complexity and difficulty in measurement.
- The neutral rate is more relevant in discussions of fiscal policy and the sustainability of public debt, as it determines whether a given fiscal path is manageable or calamitous.
- The natural rate of interest is expected to rise, making it harder to tame the debt trajectory, with factors such as fiscal excess, demographic change, and global economic fragmentation contributing to the increase.
The idea of a “neutral” or “natural” rate of interest looms over discussions of US monetary policy. Whether it’s any help in setting the course of monetary policy is questionable. Yet there’s no doubt it belongs at the center of a different, equally important discussion — on the sustainability of public debt. In that context, it gets far too little attention.
Briefly, using the neutral rate as a starting point for setting the Federal Reserve’s policy rate is unhelpful. You can define that idea in many different ways; however you define it, it’s hard to measure. Put simply, it’s the interest rate that balances saving and investment with stable inflation and no transitory shocks. Observers infer the Fed’s estimate of this number from the periodic “dot plot.” Beyond 2028, the central bank expects inflation to be back on target at 2% with the federal funds rate at 3%. So, the Fed thinks the neutral policy rate, in due course, will be 3% in nominal terms, or 1% after adjusting for inflation.
This doesn’t tell you what the neutral rate is right now — with inflation running well above the 2% target and all manner of shocks pushing this way and that. Even if you could filter out the shocks, the here-and-now neutral rate would be unclear in principle. The term could mean “not pressing up or down on inflation,” as many investors probably suppose. But many academic researchers take it to mean something else: the rate that would bring inflation back to target, either quickly, or slowly, or eventually.
If you ask central bankers where the policy rate stands right now in relation to the neutral rate, they will usually tell you, “It depends on what you mean by neutral.” Fed Chair Jerome Powell says that the current rate is “modestly restrictive.” He’ll keep saying the same if the Fed (as expected) cuts again later this month and then again in December, as long as inflation is still above target. Given all the complications and uncertainties, he’s unlikely ever to tell investors what they would love to know: how many basis points above the here-and-now neutral rate he believes the policy rate to be.
In short, the neutral rate is no help in fine-tuning monetary policy, and it’s probably a downright nuisance in explaining where the Fed stands. But the idea works much better for looking farther ahead. In fact, it’s indispensable to thinking intelligently about fiscal policy.
The US has settled into a posture of unprecedented fiscal lassitude. With the economy at full employment, the budget deficit stands at around 6% of GDP. Current policy projections show the ratio of public debt to GDP, already as high as the peak immediately after 1945, rising further and indefinitely — and nobody in Congress or the administration seems to mind. Earlier this year, the Congressional Budget Office projected an increase from 100% in 2025 to 156% by 2054. According to the Yale Budget Lab, the One Big Beautiful Bill Act will push that number to more than 194%. (Neither estimate takes account of tariff revenues, which remain anybody’s guess — but they won’t come close to stabilizing the debt ratio, let alone reducing it.)
The long-term neutral rate — for this purpose, let’s say “natural” rate — determines whether any given fiscal path is manageable or calamitous. Economists agree that the natural rate has declined over recent decades, perhaps by as much as three percentage points in real terms. This fall seemed to justify a more relaxed approach to fiscal discipline. If the natural rate is less than the rate of growth in GDP, budget deficits in moderation are sustainable — meaning consistent with a stable or falling ratio of debt to output.
Those days are over. The US budget deficit is now extraordinarily immoderate, the expected rate of economic growth is lower than before and the natural rate of interest is going up.
Just how much the natural rate might rise is of surpassing importance. It’s another complicated question. An excellent new book by my colleagues at Bloomberg Economics, The Price of Money, surveys the research and concludes that the real natural rate for US 10-year government debt fell from nearly 5% in 1970 to 1.7% in 2012, and is now on course to climb back to 2.8% by 2030. Combined with slower growth, this seemingly small change would make taming the debt trajectory much harder.
What’s driving the natural rate? Recall that it’s the interest rate that balances savings and investment. Fiscal excess is therefore a big factor. Budget deficits reduce national saving, which pushes up the natural rate, which in turn makes the debt more expensive to service, adding further to budget deficits. Note that the Bloomberg researchers predicate their estimated natural rate of 2.8% on the assumption that “governments get their finances under control and debt ratios stabilize.” If they don’t, the rate will rise faster.
Many other factors are in play, Slow growth pushes down the natural rate, because it makes investment less attractive. Pushing the other way is the need for greater investment in defense and clean energy. Demographic change raises the natural rate because a higher ratio of dependents to workers means less private saving and, most likely, higher budget deficits. Weaponization of the dollar through sanctions against Russia, China’s efforts to lessen its dollar dependence, and global economic fragmentation will cut demand for safe US assets — lowering their price and raising the natural rate. For decades, the prices of investment goods trended lower relative to consumer goods, pushing the natural rate down; that force is likely to be weaker from now on.
On balance, a continuing upward trend in the natural rate looks likely. To my mind, 2.8% in real terms by 2030 looks optimistic. And this trajectory is on a collision course with an ever more deeply entrenched complacency about budget deficits. So yes, let’s focus on the natural rate — not to get monetary policy right, but to peer into the fiscal pit we’re digging.
Read the full article HERE.
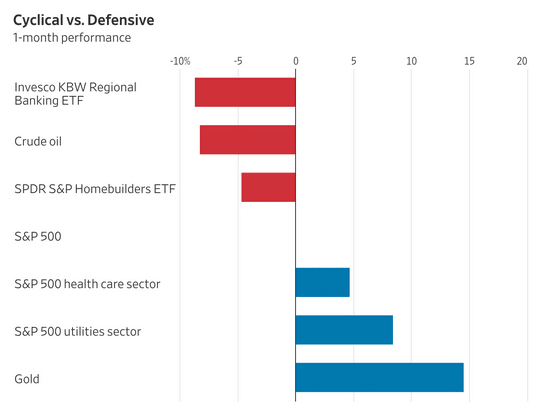
Utilities, healthcare and consumer staples are leading the S&P 500 this month
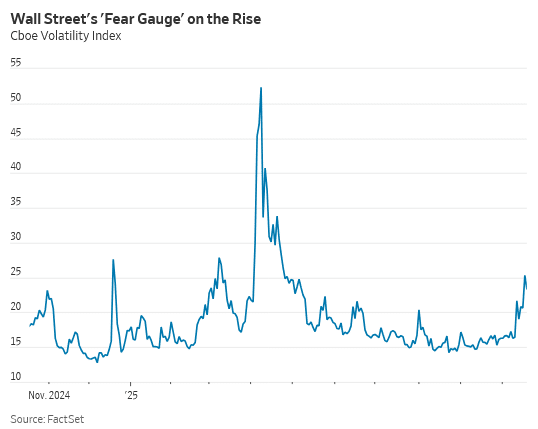
Wall Street is starting to get a little defensive.
In the midst of the market’s most unsettling stretch since August, investors have turned to utilities, healthcare stocks and consumer staples—industries that reliably churn out profits no matter the economic conditions. Electricity, drugs and groceries are always in demand, even when consumers buy fewer cars, phones and streaming services. Those three defensive sectors are on track to lead the S&P 500 index this month for the first time since June 2022.
Investors have also sheltered in bonds. The 10-year Treasury yield, which falls when bond prices rise, has dropped close to half a percentage point over the last three months to close below 4% for the first time in a year on Thursday. And gold hit another series of new records this past week.
“We’ve been living in a disconnected environment for the last six months where the market just chugs higher and the news just gets worse,” said Alex Chaloff, chief investment officer at Bernstein Private Wealth Management.
Volatility returned to the market on Oct. 10, when stocks tumbled after President Trump and Chinese leader Xi Jinping revived their trade-war rhetoric. The major stock indexes quickly regained their footing, and the S&P 500 is now within 1.4% of its Oct. 8 record.
Below the surface, though, investors are pulling back from holdings more sensitive to a slowing economy.
Regional bank, retailer, home-builder and airline stocks have all tumbled over the past month. These industries tend to flourish during periods of economic growth. Meanwhile, the surprise bankruptcies of auto-parts supplier First Brands and auto lender Tricolor have raised concerns that the market’s rally has masked pockets of weakness and potential fraud—particularly in the more opaque corners of the debt markets.
“When you see one cockroach, there are probably more,” JPMorgan Chase Chief Executive Jamie Dimon said Tuesday after his bank reported a $170 million charge-off related to Tricolor.
Shares of the investment bank Jefferies Financial Group, a key lender to First Brands, are down 27% over the past month, though they blunted some of the losses on Friday after Jefferies executives addressed First Brands during the firm’s investor meeting. Major private credit players such as KKR and Apollo Global Management have also sold off.
The credit scrutiny has spilled into the nation’s regional banks. Zions Bancorp reported a $50 million charge-off Wednesday to cover two loans taken out by borrowers facing legal actions. Western Alliance said Thursday that it had filed a lawsuit accusing one of its borrowers of fraud. The KBW Regional Banking Index fell sharply afterward.
Zions is scheduled to report quarterly earnings this week, along with heavyweights Tesla, Netflix, Intel and Procter & Gamble. On Friday, investors will get a key reading on monthly consumer inflation.
The extra yield investors demand to invest in junk-rated corporate bonds over Treasurys recently climbed to its highest level since June, according to the ICE BofA U.S. High Yield Index.
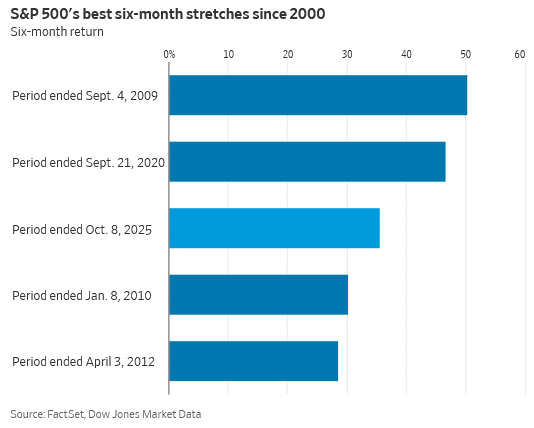
These flare-ups have arrived just as the S&P 500 has capped one of its hottest six-month runs on record. Powered by the biggest tech stocks and enthusiasm for the AI boom, the market ripped through dozens of record highs.
Bullish investors note that corporate earnings have been very strong in aggregate. Analysts expect 16% earnings growth for S&P 500 companies over the next year, the best growth rate since the 2021 Covid recovery. Rate-cut expectations are also helping out stock valuations, though analysts say that effect has been fully priced in.
“Underneath it all, I think the fundamentals are still intact,” said Jurrien Timmer, director of global macro at Fidelity Investments. “I see quite a few reasons out there to still be bullish even if some areas might look overextended.”
The recent spate of disconcerting news has felt sudden—and jarring.
“The strength in megacap tech has obfuscated what appears to be increasing signs of weakness through much of the real economy,” said Bob Elliott, chief executive at Unlimited Funds. “And the pricing of that weakness has accelerated in recent weeks.”
Bernstein’s Chaloff doesn’t think a recession is imminent, but he’s concerned about the effect of a still-sluggish labor market on consumer spending.
“The low-end consumer is hurting,” he said. “Those increases in discretionary spending we saw post-Covid have been tempered, and that’s starting to show up in results and stock prices.”
Part of this year’s market exuberance has been based on the idea that tax cuts and falling interest rates will heat up the economy, fueling a new burst of growth. So far, investors are still waiting.
While the federal government shutdown has turned the lights off at the Bureau of Labor Statistics, a host of alternative data from Wall Street is pointing in the same direction: The U.S. labor market is still losing steam.
Of course, so-called real economy companies are playing a smaller role than ever in the 2025 AI-fueled bull market. And the companies and investors spending hundreds of billions on AI-related infrastructure are helping boost the economy: The government’s most recent GDP report showed AI spending propelled economic growth while consumer spending stagnated.
Read the full article HERE.

Key Points
- Zions Bancorporation will take a $50 million charge-off in the third quarter due to activity by two commercial and industrial borrowers.
- Zions shares fell 4.8% and the KBW Regional Banking Index dropped 4.8%, its worst one-day decline since April.
- Non-depository financial institutions (NDFIs) now constitute 33% of all commercial and industrial loans from large banks.
New worries about loans by regional banks are sinking stocks as investors fear there’s a bumpy road ahead for credit markets. It comes after the bankruptcies of two auto-industry companies last month turned up the pressure on the banking industry.
The CEO of the biggest U.S. bank, JPMorgan’s Jamie Dimon, raised the issue of those bankruptcies—of subprime auto lender Tricolor Holdings and auto parts maker First Brands—this week, referring to credit market risk when he made the comment “when you see one cockroach, there’s probably more.”
In addition, International Monetary Fund managing director Kristalina Georgieva expressed concern during the IMF/World Bank meetings in Washington, D.C., on Thursday.
More banks are unearthing issues. After the market close on Wednesday, Zions Bancorporation
said it recently became aware of “legal actions initiated by several banks and other lenders” against parties affiliated with two of its commercial and industrial borrowers, with the loans also having guarantees from other individuals.
The upshot is that it will take a $50 million charge-off in its third quarter as part of a $60 million provision related to the loans. Zions shares are falling, and some are speculating that Tricolor and First Brands are the unnamed borrowers.
Truist analyst David Smith doesn’t think investors should jump to conclusions however, given that both those bankruptcies are old news, and Zions has filed lawsuits to cover these loans in California, a state without an apparent connection to Tricolor and First Brands (although that latter point could change).
Either way, however “the credit charges are not helpful for Zions (duh) when investors had gotten a bit squeamish in recent quarters about rising classified loans at the bank, even though the increase seemed to have been driven by a technical regulatory rule change as opposed to a big underlying problem,” he writes. “But is it a good thing or a bad thing in credit terms if these loans went bad due to fraud as opposed to the normal course of business? Either way, there have been enough ‘one-offs’ in commercial credits for banks of late that investors are selling first and asking questions later.”
Zions shares were down 4.8% on Thursday. The news was weighing on other regional banks, with the KBW Regional Banking Index down 4.8% and on pace for its worst one-day decline since April 10, according to Dow Jones Market Data. And the worries were weighing on stocks broadly, with the Dow Jones Industrial Average and the S&P 500SPX-0.03% down 0.8%.
Evercore ISI analyst John Pancari notes that Zions classified the loans as a non-depository financial institution (NDFI), meaning he views the “announcement as the latest in a series of recent credit issues related to fraud and/or bankruptcies within the NDFI space — and expect the topic to remain top of mind for investors and to likely fuel added apprehension around bank NDFI exposures.”
Moreover he highlights that companies including PNC Financial Services Group, Wells Fargo, KeyCorp, First Horizon, Regions Financial, Synovus Financial US Bancorp have relatively high NDFI loan concentrations.
Another regional lender, Western Alliance Bancorporation, came under scrutiny for its hefty NDFI loan book, and its stock fell 10%. In a securities filing it reaffirmed its full-year guidance. But it sued a borrower in August, saying Thursday existing collateral should cover the borrower’s obligation. Nonetheless, it “is still poor optics for Western Alliance’s hefty NDFI lending book coming after concerns last week over a loan to a fund holding First Brands receivables,” Smith notes.
Overall, NDFIs now account for some 33% of all commercial and industrial loans originated by large banks. This was brought to investors’ attention in September, when subprime auto lender Tricolor Holdings and auto parts maker First Brands both went belly up.
There is a silver lining in that it doesn’t appear either bankrupt company holds wider implications about the economy.
For Tricolor, some worry that its lower-income consumers may have become unable to keep up with high interest rate payments in droves. “If that was the reason, it could mean that the lower end of the economy is buckling under tariffs, inflation and slower hiring and that could mean subprime loans across industries could be at risk (and anyone who remembers 2008-2009 knows how bad that can go!)” writes Sevens Report President Tom Essaye.
For First Brands, the concern was more that it was reliant on private credit from sources including private equity and hedge funds. If money was so abundant that First Brands and others were focused on chasing it at the expense of sound business practices, more could follow suit and reverberate among Wall Street lenders.
Luckily for the broader economy, Essaye writes that most now believe that’s not the case, but rather bad or potentially fraudulent financing decisions by management, including allegedly using the same collateral to secure multiple loans. Neither company returned a request for comment.
Overall, these may be isolated incidents. Yet taken together, it’s easy to see why more investors are getting nervous.
Read the full article HERE.
Today on the Big Take: Gold thrives in times of uncertainty. But the scale and the speed of today’s rally exposes deeper concerns about the global economy.

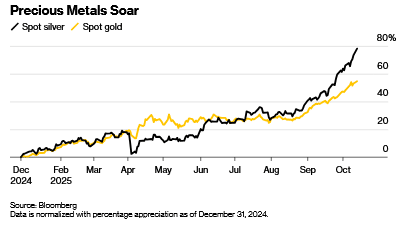
Gold always shines during uncertain times, but escalating tensions between the US and China and signals from the Federal Reserve that we could see at least one more rate cut this year have propelled gold – and silver – to record highs.
Today on the Big Take, Bloomberg precious metals reporter Jack Ryan and host Sarah Holder talk about what’s pushing up gold’s value — and what history can teach us about how this gold rush could end.
Here is a lightly edited transcript of the conversation:
Dave Packer: How high can gold go?
Sarah Holder: Gold has been on a record setting run lately…
Tom MacKenzie: Look at that. Gold up nine tenths of a percent. The gains keep coming for gold.
Denise Pellegrini: If I check right now, gold is at a record $4,202 an ounce.
Holder: The commodity broke $4,200 an ounce on Wednesday – the latest high in a gold rush of historic proportions.
Jack Ryan: This has been an incredible year for gold.
Holder: That’s Jack Ryan, Bloomberg’s commodities and precious metals reporter.
Ryan: If we were to end the year now, it would be the best year since 1979. It’s up by about 55% this year.
Holder: This incredible year for gold – has also been an incredible year for some other shiny commodities.
Ryan: I mean, gold is actually, in one sense, the weakest performer of them. Platinum’s up by about 80% silver by about 75%. So all of the precious metals are moving higher this year, and there’s a lot of reasons behind that.
Holder: Jack says – all this interest in precious metals is a sign of our uncertain times.
Ryan: Gold I think often operates as a barometer for geopolitical tension or what’s happening in the global financial system. So watching the gold price can actually be quite a useful tool to kind of take the pulse of what’s happening in the world at that particular moment.
Holder: People have long rushed to buy gold when the economy seems weak or unstable. But the scale and the speed of this gold rally is different. Just when the pace of growth looked to be slowing down last week, it started up again, amid escalating US-China tensions over tariffs – and a signal from US Federal Reserve chair Jerome Powell that at least one more rate cut could be coming this year. And while some high-profile voices in the financial world are sympathetic to the turn toward gold, like JP Morgan Chase CEO Jamie Dimon…
Jamie Dimon : This is one of the few times in my life it’s semi-rational to have some in your portfolio.
Holder: It’s also raising alarm bells for some investors… like Ken Griffin, CEO of the global investment firm Citadel.
Ken Griffin: …as you see central banks around the world, as you see individual investors around the world go, you know what? I now view gold as a safe harbor asset in a way that the dollar used to be viewed. That’s what’s really concerning to me…
Holder: Jack says that the gold rush… and the debate around it… reflect something deeper about the way investors are thinking about the economy — and the world — right now.
Ryan: Holding the currencies even, not even just the debt of a foreign country is an implicit expression of trust in those countries. And when you maybe trust them less, an asset that doesn’t have any counterparty might become more appealing. And that really, I think if you boil it down, has been the thing that’s really supported gold.
Holder: I’m Sarah Holder, and this is the Big Take from Bloomberg News. Today on the show: What’s behind gold — and silver’s — record smashing runs. And what can history teach us about how this gold rush could end.
Holder: If there’s one thing you should know about gold – it’s that it thrives in a crisis.
Ryan: Gold broke a thousand dollars as Bear Stearns was kind of collapsing in 2008. And $2000, a few months after the start of the pandemic.
Holder: That’s Jack Ryan, who covers precious metals for Bloomberg.
Ryan: $3,000 earlier this year. You could say it was the kind of trade war that was expanding, Liberation Day was just coming up. And so now you look at when it crossed the threshold of $4,000, what’s been happening in the world?
Holder: Geopolitical tensions, trade wars, high inflation. It’s been crisis after crisis – and all the bad news has been good news for gold.
Ryan: When you talk to investors and people in the market, a key turning point for the gold market seems to have been when Russia’s assets, foreign exchange assets, were frozen.
Holder: That was in 2022, at the beginning of Russia’s invasion of Ukraine.
Ryan: And those were treasuries, those were assets denominated in dollars, in pounds, in yen, G-7 currencies. And that, I think, was a key moment for central banks around the world. Because they looked at that and they realized that, if they came into conflict with the west at some point in the future, they could potentially lose access to the reserves, presumably at the time when they would actually need it the most. Gold, on the other hand, as long as you start within your own borders, it can’t be frozen, it can’t be taken from you. And so from that point on, buying of gold by central banks roughly doubled from about 500 tons a year before that to about a thousand tons a year now.
Holder: Jack says, the central banks that have been building up their gold reserves the most aggressively have a few things in common.
Ryan: China being a really important buyer – probably the most important buyer. India has also been adding to its reserves. And Eastern Europe as well. So Poland, Serbia, the Czech Republic, they’ve all been buying quite a lot of gold. It’s countries who are not part of the post-second World War Bretton Woods system, a global monetary order underpinned by gold. These are countries that didn’t take part in that but are, are now large economies. And they’re building gold reserves that are beginning to be commensurate with the kind of massive holds that were built up by the United States, France, Switzerland, Italy, other countries like that.
Holder: But it’s not just central banks that are seeing the appeal of gold right now. Other investors are flocking to gold as the Trump administration ratchets up pressure on the US Federal Reserve.
Ryan: One important one has been some of the attacks on the independence or perceived independence of the Federal Reserve. The efforts to fire one of the governors, Lisa Cook, that I think has been a really key kind of source of support for gold because if you had a pliant Federal Reserve, it sets up this kind of possible goldilocks situation.
Holder: Lisa Cook is fighting Trump’s attempt to remove her and the Supreme Court will hear the case early next year. In the meantime, Fed chair Jerome Powell has been firm that the Federal Reserve retains its independence. But a weakening labor market has pushed the Fed to start cutting interest rates: In September, it lowered them by a quarter percentage point and this week, Powell suggested another rate cut could be coming at the end of October. And that means gold could start looking a lot better for investors who might otherwise want to earn interest on their cash or on bonds.
Ryan: Your cash in the bank becomes less appealing and treasuries become less appealing and non yield in gold becomes more attractive.
Holder: So it’s a Goldilocks situation for gold, no pun intended, as you said.
Ryan: Possibly. Yeah.
Holder: Meanwhile, these factors – and some others — have also been driving up the price of gold’s notoriously volatile cousin: Silver.
Ryan: Often if gold moves one way, silver will move twice as far the same direction. And I mean, it’s done something similar to that this year. And for silver, there’s kind of diverse use cases. I mean, gold is used either in jewelry or it’s used essentially just as an investment asset. Whereas silver has quite a sizable chunk of annual silver supply goes into industrial applications: photovoltaic solar cells. That’s a growing source of demand. And so for the last couple of years, the market has been in deficit. There is a lot of silver in vaults around the world. So the world isn’t going to imminently run out of silver. But you have that deficit situation, and then on top of that investors are looking at the volume of debt that’s held by some western European countries, the United States, wondering about how that can be resolved. And so they’re looking at the risk of currency debasement and how they can hedge against that. And they think maybe cryptocurrencies, maybe precious metals, maybe real estate, maybe these are kind of assets that we can hedge against this risk.
Holder: With all of this rush to “buy gold,” it’s worth noting: buying a commodity like gold or silver looks pretty different from buying a US treasury bond… or a share of a stock on the S&P.
Ryan: There’s many ways to do it and you can kind of scale based on maybe how paranoid you are about, or paranoid or concerned about whether or not you’ll be able to get access to your investment. You can buy a small bar or a coin from a bullion dealer. There’s probably a visceral appeal just to having, gold coins under your bed or something like that.
Holder: For investors who don’t need to stash their doubloons under their mattress, Jack says another route is trading gold futures or buying gold-backed stable-coins. Other investors are buying precious metals through exchange traded funds. These gold – or silver – backed ETFs give an investor a share of the commodities they hold.
Ryan: That’s an easy, straightforward, relatively low cost way to get exposure to gold and silver, and it’s very popular.
Holder: OK, so there’s both tangible and intangible ways to invest. I’m wondering, are there examples of how this run on the metals market is creating logistical craziness in the physical world?
Ryan: It’s funny, at the start of the year, investors were concerned about the possibility that gold, silver, these various other precious metals would be tariffed. And because of that, prices in the US started creeping higher as people exited their shorts. And that led to this great arbitrage situation where you could buy gold in London for cheaper and sell it in New York for more. And in order to do that, you had to fly the stuff over, so typically with gold, you’ll store it in the hold of a passenger flight. So probably if you fly New York-London, it’s quite possible that underneath your seat — you won’t be aware of it for security reasons — but there is gold.
Holder: As of September, President Trump has said that gold, at least, was not going to be subject to tariffs. But because of the massive outflow of precious metals during that uneasy period, London is still short on silver.
Ryan: Now we’re seeing a big premium actually for silver in London and some of that metal that traders went a massive effort to get to New York. They’re now flying it back to London because the arbitrage now works the other way. You can buy it for less in New York and sell it for more in London.
Holder: Wow. So they’re basically saying, turn this flight around. We gotta get that silver back to London.
Ryan: Absolutely.
Holder: After the break – what we can learn from the last time the value of gold spiked by historic proportions – and what bears and bulls are saying about where precious metal prices go from here.
Holder: Gold is officially more valuable than ever. But Bloomberg precious metals reporter Jack Ryan says it’s not the first time a gold rush made history.
Ryan: So these are good times for gold. But the best times for gold was the 1970s.
Holder: Up until then, anyone who held US dollars could, in theory, trade them in for gold. But at the start of the 70s, President Richard Nixon ended the gold standard. Dollar prices floated freely. And the price of gold started to rise.
Ryan: Throughout the 1970s, in a lot of western economies, particularly in the US you had stagflation, you had weak growth and high inflation. And gold ripped through that period, particularly as you got to the latter stage of that decade and you had the oil crisis, really sky high inflation, Vietnam, lots of government borrowing in order to pay for that. And throughout that period, historians and scholars will tell you that Nixon was putting pressure on the Fed. He was putting pressure on the chair, Arthur Burns to keep interest rates lower than perhaps they should have been. And I mean, you could argue that there are some echoes of that, today. And then you had a peak in January, 1980, and just prior to that, president Jimmy Carter had frozen some Iranian assets. It’s a similar moment to G-7 countries freezing Russian assets in that there was many oil producing countries that had built up vast fortunes of dollars from selling oil at incredibly high prices throughout the 1970s because of the oil crisis, realized that those dollars were vulnerable. And that actually maybe they should start buying more gold and increase their allocation to gold.
Holder: And what stopped the price from climbing more? When did things start to reverse course?
Ryan: People who traded, who were trading at that time, they, they describe it as this remarkable day. Gold peaked at about $800 an ounce in January, 1980. So $800 in 1980s money, about $3,600. I mean, it never returned there for the rest of the 20th century. It quickly tumbled in the years following that as interest rates came up and precious metals started to face into lots of different headwinds. And so I guess there maybe there is a cautionary tale in that, it skyrocketed to a peak and then lost ground. And went through many years of kind of pretty mediocre to poor performance.
Holder: Well, Jack, we’ve talked about some of the reasons why people are flocking to gold and silver right now, but not everyone is always so bullish on gold. I know Warren Buffett is famously critical of the asset, saying it’s essentially a way to quote, go long on fear.
Warren Buffett: Gold really doesn’t have utility. I would bet on good producing businesses to outperform something that doesn’t do anything.
Holder: What are the downsides of investing in gold right now or ever?
Ryan: I mean, there is absolutely valid criticisms of it; one of the most basic and fundamental ones is that it’s not very useful. I guess any investor would, and probably should be nervous if they’re buying into a market where they look at the price chart and it’s almost been a straight line upwards for two, three years. There’s some sentiment in the market that you might feel is, you know, it feels a bit toppy, maybe that there’s some speculative fervor. Retail hasn’t been a big part of the rally thus far, but I suspect that might be changing. You can find images online of, gold buyers queuing outside refiners. One trader sent that to me and, and he said, that’s a bad sign. But it’s a bit like they say, you know, if your dad calls you and said, ‘Should I invest in this?’ They are the last person heard about that.
Holder: It’s already too late.
Ryan: And that is a warning sign to get out.
Holder: Where do analysts expect these precious metals values to go from here?
Ryan: Well, it’s, it’s remarkable how much gold has soared past almost any analyst’s expectations both this year and last year. Looking into the next year, most banks, most analysts are, are pretty bullish. Bank of America sees $5,000 an ounce by the end of next year. Most of the other banks, according to the most recent reports, see it going higher still. It’s a notoriously hard metal to predict and to price because it doesn’t generate an income. The value of any financial security is a function of its income ultimately and the possibility of that changing. With gold you don’t have that, and it’s so sentiment driven that I really, I, I do feel sorry for anyone whose job it is, is to predict where it’s gonna go.
Holder: What could actually happen to seriously jolt the price back down?
Ryan: It’s a very important question to ask. It’s a very good question to ask. There could be kind of significant easing of tensions in the Middle East or in Russia and Ukraine.
Holder: More peace in the world.
Ryan: Yeah. More good things and less bad things if you’re willing to take that bet.
Holder: Yeah.
Ryan: If geopolitics was to turn that direction then gold might find itself in a more and more marginal role. There’s not been many people who’ve been willing to take that side of the bet, to bet on kind of peace and trust and the kind of rebuilding of multilateral institutions. And that is part of the reason why gold has doubled in the last two years.
Read the full article HERE.
Here’s what could happen to gold prices next.
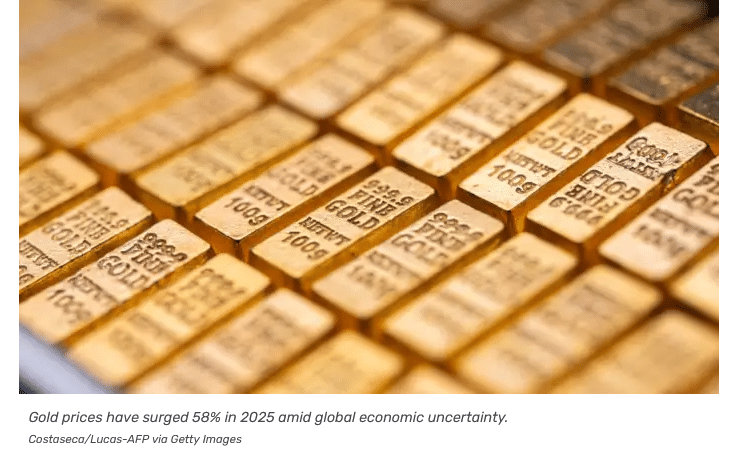
Gold prices are on a tear this year as concerns mount due to rising inflation and unemployment—a double-barreled risk to the U.S. economy.
The yellow metal has surged 58% in 2025, trouncing the S&P 500, which is up just 13% year-to-date. Not even the AI-driven and technology-heavy Nasdaq has kept pace. It’s up 17%—solid, but nowhere near gold’s eye-popping return.
Gold’s ascent, which has it trading at all-time highs near $4,182, has gold bugs smiling, but likely wondering if the rally is near over. While anything can (and often does) happen, speculators may not want to lock in their gains, based on the latest take from Bank of America.
The popular bank, which has one of the most respected Wall Street research teams, just updated its gold price forecast, and its target for 2026 will likely turn some heads.
Gold prices can continue climbing in 2026
Demand for gold has been nothing less than impressive, and interest has spread beyond those who like owning physical gold bars and coins to everyday investors who quickly recognize that allocating some of their money to precious metals can be profit-friendly.
According to Bank of America’s number crunchers, gold exchange-traded-fund buying increased 880% in September, attracting $14 billion in assets—an all-time high. Physical and paper buying of gold also grew quickly.
Bank of America expects demand to remain strong into 2026.
“The White House’s unorthodox policy framework should remain supportive for gold given fiscal deficits, rising debt, intentions to reduce the current account deficit/capital inflows, along with a push to cut rates with inflation around 3%,” wrote Bank of America’s analysts.
The combination of drivers has Bank of America betting that investment demand for gold next year will match what it was in 2025, climbing 14%.
As a result, the bank is adjusting its gold price forecast now that it’s eclipsed its prior $4,000 forecast.
“We see the risk of a correction near-term, but still expect further upside in 2026, with gold and silver potentially rising to $5,000/oz.” said the analysts.
The potential for the yellow metal to surge double-digit percentages again next year from current levels won’t happen in a straight line, though.
Gold is due for a correction, but it will be short-lived
Zoom in on any long-term price chart and you’ll see plenty of pops and drops. That’s particularly true for gold, historically prone to jaw-dropping booms and busts.
While Bank of America doesn’t expect a bust yet, it thinks that gold’s recent surge has set the stage for a pullback.
“We remain bullish gold, but are also concerned that prices might consolidate near-term,” wrote the analysts. “Indeed, downside risks are being discussed a lot and we will look out for the following: 1) the Supreme Court ruling on President Trump’s tariffs; 2) a hawkish pivot from the Fed if economic data improves; and 3) the outcome of the US mid-term elections.”
Tariffs have been a gold tailwind because they’re inflationary and create geopolitical instability while also encouraging a shift away from the U.S. Dollar. If the Fed were to abandon rate cuts, which are also inflationary, it could also dent gold’s rally. Furthermore, the mercurial nature of the current administration has been a positive for gold, so a shift in Congress could impact prices.
Those risks to the long-gold argument shouldn’t be ignored. Still, Bank of America thinks that consolidation will prove temporary, believing that gold prices can hold $4,000 as long as investors don’t hit the sell button, and that a slate of data puts odds of demand increasing in 2026, not falling, including:
- Elevated fiscal deficits.
- Rising debt.
- A push to cut rates, with inflation still running at around 3%.
Gold is considered a safe-haven asset, so rising debt and deficits and the growing concern about financing them are healthy tailwinds.
Billionaire Ray Dalio has been pounding the table all year about the risk to the U.S. if it doesn’t get its fiscal house in order, and he’s on record saying that gold deserves a spot in portfolios as a result.
Gold also performs best during periods of inflation, when the purchasing power of the U.S. Dollar shrinks. With tariffs pressuring inflation and the Fed’s newfound friendly monetary policy likely to mean more inflationary rate cuts, the backdrop for gold remains favorable.
Of course, there aren’t any guarantees. Gold has had some pretty seismic drops historically when economic conditions have stabilized. One needs to look no further than 2011, when post-Great Recession action caused it to hit all-time highs before nose-diving 45% through December 2015.
Read the full article HERE.
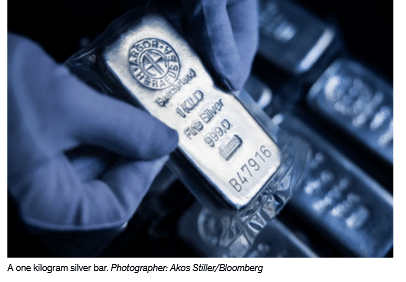
Gold has staged a dramatic rally this year as Russia’s war in Ukraine and the US Trump administration’s unorthodox economic policies sent investors and central banks reaching for safe-haven assets. Right now, however, it’s silver that’s stealing the spotlight.
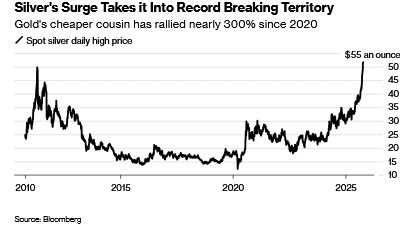
A squeeze in supply of the precious metal has catapulted it to a 70% gain on the London market this year, compared with a 55% increase for gold as of mid-October. Both have been experiencing a surge in demand from investors, who value their price stability through periods of political turbulence, inflation and currency weakness.
Unlike gold, silver isn’t just scarce and beautiful: It also has useful real-world properties that make it a valuable component in a range of products. With inventories at their lowest in years and investors still scrambling for more, there’s a risk of supply shortages that could impact multiple industries.
Who needs silver?
Political and fiscal uncertainty this year in major economies including the US, France and Japan is putting pressure on their currencies, and investors have been hedging their exposure to US dollars, euros and yen by acquiring assets like gold and silver in what’s been termed the “debasement trade.”
Silver is an excellent electrical conductor that’s used in circuit boards and switches, electric vehicles, batteries and solar panels. It’s also used in coatings for medical devices. And like gold, it’s still a popular ingredient for making jewelry and coins. As a tradable asset, it’s cheaper than gold per ounce, making it more accessible to retail investors, and its price tends to move more sharply during precious metal rallies.
China and India remain the top buyers of silver, thanks to their vast industrial bases, large populations and the important role that silver jewelry continues to play as a store of value passed down the generations.
Governments and mints also consume large quantities of silver to produce bullion coins and other products.
What makes the silver market unique?
Silver’s varied uses mean its market price is influenced by a wide array of events including shifts in manufacturing cycles and interest rates and even renewable energy policy. When the global economy accelerates, industrial demand tends to push silver higher. When recessions loom, investors often step in as alternative buyers.
The market is thinner than with gold. Daily turnover is smaller, inventories are tighter and liquidity can evaporate quickly. That isn’t because there is less silver than gold available for trading. In fact, it’s the opposite: There are about 790 million ounces of silver in vaults overseen by the London Bullion Market Association, compared with 284 million ounces of gold. But silver is far less valuable per weight. The silver stored in London is worth about $40 billion, while the gold is worth $1.1 trillion.
What drove the latest silver squeeze?
LBMA data show silver inventories in London — the backbone of the global trade — have dropped by roughly a third since mid-2021, leaving less metal available for lending or delivery. Global demand for silver has outpaced the output from mines for four consecutive years, eroding the supply buffer once held in London. Meanwhile, silver-backed exchange-traded funds have drawn in new investment, forcing custodians to secure physical bars just as available supply was dwindling.
A proposed US tariff on certain imported metals earlier this year added fuel to the fire, spurring speculative buying and depleting inventories even further. Spot prices in London are trading at multi-year premiums to futures in New York.
The result has been strained liquidity and a scramble to secure silver bars.
Why all the demand from India?
The country’s festive season, culminating in Diwali on Oct. 20, is traditionally a peak period for precious metal buying. Silver imports have nearly doubled from last year as jewelers rushed to restock amid soaring bullion prices.
Indian buyers are now paying premiums of 10% or more over global benchmark prices, underscoring how tight physical supply has become. That demand has siphoned off even more metal from Western vaults, worsening the squeeze.
What does this mean for industries that rely on silver?
Some traders have been booking space on transatlantic cargo flights for bulky silver bars — an expensive transport method typically reserved for gold — to capture price differentials between London and New York.
For sectors like solar panel manufacturing, in which silver paste is a critical ingredient, sustained high prices could begin to erode profitability and spur efforts to substitute silver components for other metals.
Where could new supply come from?
Global mine production has been constrained by declining ore grades and limited new project development. Mexico, Peru, and China — the top three producers — have all faced setbacks ranging from regulatory hurdles to environmental restrictions. Reshuffling inventory from New York to London might solve the immediate crisis, but it won’t fix persistent supply deficits.
Whether the market finds a balance — or faces another bout of panic buying — will depend on how quickly new supply can reach the vaults.
Read the full article HERE.

Gold prices scaled to another record high on Monday as investors revved up their safe-haven bets after U.S. President Donald Trump renewed tariff threats against China, while expectations of U.S. interest rate cuts added to the metal’s allure.
Silver also jumped to an all-time peak, tracking gold’s rally.
Spot gold was up 1.64% to a record $4,083.42 per ounce. U.S. gold futures for December delivery surged 2.55% to $4,102.60.
Trump reignites trade war with China
Trump on Friday reignited the U.S. trade war with China, threatening 100% tariffs on Chinese goods imports into the United States and announcing new export controls on critical software by November 1 in a reprisal against Beijing curbing critical mineral exports.
However, Trump, posting on Truth Social on Sunday, wrote: “Don’t worry about China, it will all be fine!”
Trade tensions remain a focus for markets, said UBS analyst Giovanni Staunovo, adding that “while they have eased again between the U.S. and China, the 100% additional tariff threat remains.”
“Ongoing strong investment and central bank demand should further support gold. We target a move to $4,200/oz,” he added.
Spot silver jumped 2.22% to $51.39/oz, after hitting $51.70/oz, driven by similar factors as gold alongside tightness in the spot market.
Goldman Sachs said on Sunday that silver prices were expected to rise in the medium term due to private investment flows, but warned of heightened near-term volatility and downside risks compared to gold.
Bank of America on Monday raised its price forecasts for precious metals, lifting its 2026 outlook for gold to $5,000 an ounce and for silver to $65/oz. BofA is the first major bank to raise its gold price forecast to $5,000/oz for 2026.
On a technical basis, gold’s and silver’s Relative Strength Index stands at 80 and 83, respectively, indicating the metals are overbought.
Non-yielding bullion has gained 53% year-to-date, driven by geopolitical risks, alongside strong central bank gold-buying, exchange-traded funds inflows, Fed rate cut expectations and economic uncertainties stemming from tariffs.
Traders pricing in October, December Fed rate cuts
On the monetary policy front, traders are now pricing in a 25-basis-point cut each in October and December, with a 95% and 79.8% chance, respectively.
Fed Chair Jerome Powell has a chance to offer his guidance on monetary policy when he speaks on the economic outlook at the NABE annual meeting on Tuesday.
Several Fed officials are scheduled to speak throughout the week.
Platinum, rose 3.76% to $1,645.57and palladium gained 2.92% to $1,446.59.
Read the full article HERE.