The Black Swan author Nassim Taleb is warning that Monday’s brutal selloff in Nvidia Corp. is just a taste of what’s in store for investors who blindly piled into Wall Street’s AI-driven stock rally.
Future pullbacks could be two- or even three-times bigger than the 17% slump posted by Nvidia at the start of this week, Taleb said on the sidelines of what’s become known as Hedge Fund Week in Miami. That drop wiped $589 billion from the chip maker’s valuation, making it the worst in market history.
“This is the beginning,” Taleb told Bloomberg News in an interview after the close of markets on Monday. “The beginning of an adjustment of people to reality. Because now they realize, now, it’s no longer flawless. You have a small little chip on the glass.”
The frenzied selling was triggered by sudden fears that US tech giants may not dominate the field of artificial intelligence as expected. The concerns follow the emergence of DeepSeek, a Chinese AI startup that has demonstrated a lower-cost approach to developing the technology.
Investors interpreted that as a threat to both demand for and reliance on Nvidia’s advanced chips. Taleb said investors have until now been too focused on a single narrative: That the company’s shares would keep rising as it maintains its dominance of AI. Monday’s retreat was actually “very little” considering the risks in the industry, he said.
Crash Protection
Taleb, whose best-selling book explores the extreme impacts of rare and unpredictable occurrences, is also scientific adviser to Universa Investments. That’s a tail-risk hedge fund, which effectively offers a form of insurance to help protect portfolios from violent market events.
The former options trader is well-known on Wall Street for his gloomy pronouncements, not all of which have proved accurate. In early 2023, he said many investors were ill-prepared for the era of higher interest rates when assets may no longer be “inflating like crazy.” The benchmark US equity gauge is up almost 50% since, in large part because of the frenzy for all things AI.
Taleb and Universa’s argument is not that investors should run from the market, and hence miss such gains. Rather, they advocate allocating a sliver of portfolios toward protection from unexpected shocks.
Taleb said too many investors have been bidding up prices of firms related to AI without properly knowing the details of how it functions or is able to succeed. He described technology firms as “gray swans,” because investors underestimate the deviations in their prices that are possible in a day.
Read the full article HERE.
Rising rates would be bad news for bondholders and borrowers of all stripes, particularly the U.S. government. They cast a shadow over stocks, too.
For both bondholders and borrowers, the pain of higher interest rates may have only begun.
President Donald Trump will have to decide if he wants to be part of the problem—or part of the solution. Many of the political promises that got him elected, including tariffs, tax cuts, and heavy government spending, could push interest rates higher.
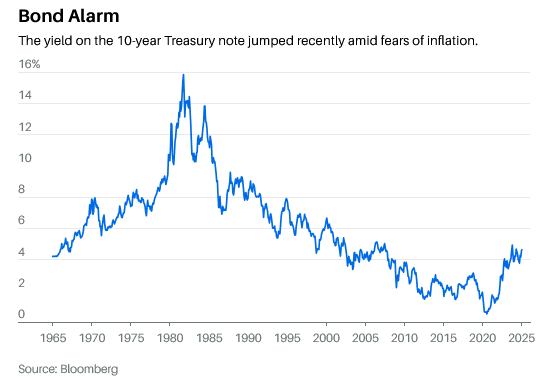
The bond market has gone through one of its most wrenching periods in history, capped by plummeting prices late last year and in early January. For investors, the rise in yields from an unprecedented zero percent to near 5% has meant the worst fixed-income returns in almost 90 years.
Housing has suffered a double whammy as new homes have become unaffordable for many buyers facing 7% interest rates on mortgages, which take their cue from bonds. And prospective sellers are frozen in place rather than trading their old 3% loans for much costlier ones.
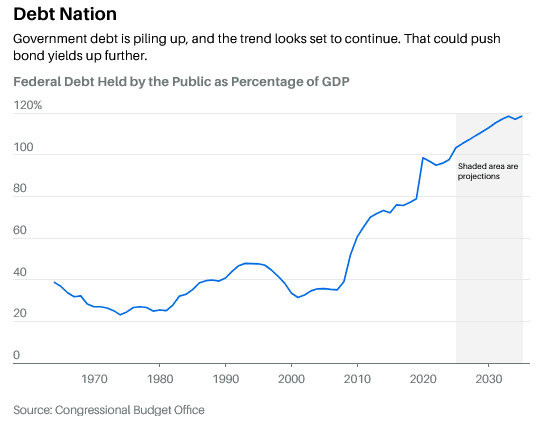
The U.S. Treasury, the world’s biggest borrower, has felt the pressure of higher bond yields most acutely. After running budget deficits previously only seen during wars or recessions, the U.S. government’s total debt has grown larger than the U.S. economy. When it could borrow at rates under 1%, this debt appeared manageable. At current borrowing costs, the government’s interest tab is the fastest-growing part of its budget, surpassing defense expenditures in 2024.
To bond investors, who are Uncle Sam’s lenders, this burgeoning debt points to still higher interest yields and lower bond prices in the years ahead. That growth is driven by ongoing deficits totaling 6% of gross domestic product, which in turn are boosted by surging interest expense on existing and new debt.
High rates are hammering borrowers. Lower-quality companies, especially those that rely on bank loans and private credit, are seeing increased credit stress. Commercial real estate is in a tightening vise as old, low-cost loans have to be refinanced at higher rates while sectors such as office buildings remain depressed.
Then there’s the stock market. Equities will suffer if bond yields keep heading higher. Late last year and into early January, stocks stumbled as the yield on the benchmark 10-year Treasury note shot up from 3.6% to 4.8%. Then equities rallied as the Treasury yield fell back by a quarter of a point on better-than-expected inflation news. The S&P 500 index hit another record this past week.
Interest rates are also front and center for President Trump. In a Thursday video address to the World Economic Forum in Davos, Switzerland, Trump said he would “demand that interest rates drop immediately,” in a public signal to the Federal Reserve.
The problem is that the bond market may not follow the central bank’s lead this time. When the Fed cut its federal-funds target by 100 basis points late last year, the 10-year Treasury yield did the exact opposite, rising to its recent peak.
Regardless of Trump’s dictates to the Fed, the bond market “is likely to price in more uncertainty because of the inherent contradictions among many of Trump’s policies, the volatility around their application (for example tariffs), and still-too-large budget deficits,” writes Steven Blitz, chief U.S. economist of TS Lombard.
Blitz thinks 10-year Treasury yields could climb to 6%, a level not seen since mid-2000. That is especially true if the Fed ends its rate cuts and lifts the fed-funds rate to 5% to 5.25% in two years, from the current target range of 4.25% to 4.5%.
A 6% Treasury yield could translate into a 7% yield on corporate bonds. “This yield level can be problematic for the equity market,” Blitz concludes. “Institutional equity market investors will likely reassess allocations, and 7% yields could accelerate the natural bias for a net outflow from the equity market among aging baby boomers.”
The current near-5% Treasury yields only look high compared with the 1.5% to 2.5% yields levels that prevailed in the decade following the financial crisis of 2008-09, notes Richard Sylla, who literally wrote the book on the subject, A History of Interest Rates.
One of the lessons of this history is that long-term interest-rate cycles typically run for 20 to 40 years, Sylla tells Barron’s. Yields bottomed around 0.3% during the Covid-19 market panic of March 2020, says Michael Hartnett, chief investment strategist at BofA Global Research. Although Hartnett predicts that bond and stock markets will rally later this year as the 10-year yield dips under 4%, he sees rising bond yields as the No. 1 long-term risk faced by investors.
Until the post-Covid updraft, yields had been tumbling. Interest rates fell over four decades, starting in 1980, with staunchly anti-inflationary monetary policies, smaller government and deregulation, and broad globalization that saw the fall of the Soviet Union, China’s emergence in the world economy, and the North American Free Trade Agreement, or Nafta, Hartnett says.
After the financial crisis, that free-market orthodoxy was flipped, with interventionist fiscal and monetary policies. Central banks drove policy rates to zero (or below, in Europe and Japan), which was augmented by massive purchases of bonds to inject liquidity, known as quantitative easing. That bond buying accommodated deficit spending by governments while lifting asset prices.
At the same time, Hartnett says, populism took hold internationally, culminating with Donald Trump’s first presidential victory in 2016 and his reelection last year. Fiscal policies turned to “extreme excess,” with the U.S. budget deficit exceeding 6% of GDP in fiscal 2024. At $36 trillion, the national debt exceeds the size of the U.S. economy.
All this makes one wonder whatever happened to the “bond vigilantes” of a previous era, says Martin Barnes, a former chief economist at BCA Research. In the 1980s and 1990s, these bond investors would rebel when fiscal and monetary policies diverged from practices that had brought interest rates down from the stagflationary 1970s. They would drive bond prices down and yields up.
Some hint of the vigilantes came with the abnormal rise in bond yields after the Fed cut last year. Sylla sees that as reaction to easing monetary policy while inflation still ran close to 3%, above the central bank’s 2% target.
Eventually, Barnes expects bond vigilantes to return, forcing the government to pay a fiscal risk premium. It’s unknown when they will exact that price. He notes that economists Carmen Reinhart and Kenneth Rogoff posited after the financial crisis that a debt-to-GDP ratio of 90% would cause economic problems. Yet U.S. total government debt exceeds 120% of GDP and hasn’t set off alarm bells.
Hartnett thinks the new administration could surprise with its spending curbs. He sees both a “devilish Trump and an angelic Trump,” with the latter slowing the deficit’s path.
Treasury Secretary-designate Scott Bessent has set an ambitious “3-3-3” plan, consisting of halving the deficit to 3% of GDP, real economic growth of 3% annually, and boosting U.S. domestic oil production by three million barrels a day. But BTIG Washington analyst Isaac Boltansky is skeptical, saying “deficit hawks are the most endangered species in Washington.”
The Department of Government Efficiency, or DOGE, led by Elon Musk is unlikely to make a dent in the deficit. Consider that in 2024 almost 60% of the $6.75 trillion in federal spending went for Medicare, Medicaid, and Social Security; while 13% went for interest on the national debt, and about the same amount for defense expenditures. Discretionary nondefense spending, the likely target for cuts, accounted for only 13% of expenditures.
The Congressional Budget Office projects the deficit to total 6.2% of GDP in 2025, shrink to 5.2% by 2027, then climb again to 6.1% by 2033. “Since the Great Depression, deficits have exceeded that level only during and shortly after World War II, the 2007-09 financial crisis, and the coronavirus pandemic,” the CBO said.
The CBO’s outlook embodies optimistic assumptions. It assumes no recessions in the coming decade. It is based on current law, notably the expiration of the Tax Cuts and Jobs Act of 2017, the signature tax measure of the first Trump administration. Renewal of the tax law, a major objective of Trump’s, would add about another $4 trillion to the debt over the next decade. And that is before adding goodies like exempting tips and taxes from overtime pay, as he promised on the campaign trail. No one knows how much tariffs will offset the shortfall at this point.
Read the full article HERE.
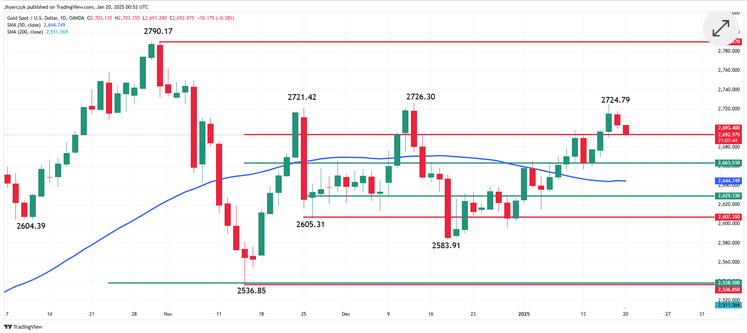
Gold rose to near a record high on dollar weakness after President Donald Trump signaled a less aggressive approach to China.
Bullion traded near $2,770 an ounce, the highest since October when it posted the previous all-time high. Trump said he’d “rather not have to use” levies against China, in an interview that aired on Fox News on Thursday in the US. A gauge of the dollar fell as much as 0.7%, making the precious metal cheaper for most buyers.
Gold is up almost 3% this week, mainly on haven demand amid uncertainty over the global economic outlook under the new US administration. Tariffs should benefit gold, in spite of accompanying dollar strength, according to Joni Teves, a strategist for UBS Group AG.
“We expect investors to be willing to look through dollar strength,” Teves wrote in a note, adding that gold would draw demand as a safe haven and diversifier in a period of volatility and macro uncertainty.
Traders have been glued to Trump’s commentary on trade and tariffs since he took office. The president has identified China, the EU, Canada and Mexico as potential targets for import levies, raising concerns about how other governments might respond. Trump on Thursday told attendees at the World Economic Forum in Davos via video that he intends to hit Europe with import levies in a bid to bring manufacturing back to the US.
The president also said he would demand an immediate drop in US interest rates. While lower borrowing costs are typically bullish for precious metals, traders were cautious as monetary policy is set by the Federal Reserve alone. The central bank is due to make a rate decision next week.
Gold set a series of records last year, with gains driven by the Fed’s pivot to cutting interest rates, geopolitical tensions and central-bank buying. Traders are now also focusing on Trump’s domestic agenda, including his pledges to cut taxes and overhaul immigration. Such moves may erode the nation’s finances and reignite inflation, potentially complicating the Fed’s rate-cutting path.
Spot gold rose 0.7% to $2,774.08 an ounce at 10:09 a.m. in London, not far short of its record of $2,790.10 an ounce. Silver, palladium and platinum all gained.
Read the full article HERE.
- The economy will probably head into a recession in a few years, Kenneth Rogoff says.
- The Harvard economist thinks a slowdown is coming in the second half of Trump’s term.
- The downturn will be influenced by factors like a slowing business cycle and tariffs, he suggested.
President Donald Trump’s plan to engineer America’s next economic boom will probably come up short in the coming years, according to Harvard University economist Kenneth Rogoff.
The Harvard professor and former International Monetary Fund chief economist said he believed the US economy would likely slow and enter a downturn in the second half of Trump’s term as president. That outcome will be influenced by a number of policies Trump suggested he would implement, Rogoff said, speaking to Yahoo! Finance on the sidelines of the World Economic Forum on Tuesday.
“I think the most likely scenario, with what I think are the most likely policies being passed, are strong, and then a slowdown into recession the second half of his term,” Rogoff said. “It’s just tough within the cycle not to do that.”
Rogoff highlighted some of Trump’s policies that could weigh on the economy. The president has promised to loosen regulation in the financial sector, a move that could potentially lead to “trouble down the road,” Rogoff said.
“And also, when you goose up the economy with these policies, most of which are not structural, they’re really demand policies, you’re going to get that effect,” he added of the potential for an economic slowdown.
Rogoff pointed to Trump’s tariff plan, with the president promising to levy tariffs on imports from China, Canada, and Mexico as soon as February 1.
Economists have said the tariffs could lead to higher inflation and higher interest rates, an idea Trump has pushed back on. Trump levied tariffs during his first term as president without a significant inflation increase. However, his proposals for tariff policy in his second term are more expansive, explaining the difference in inflation forecasts.
Rogoff said the inflationary impact of the tariffs could be minor, though he believed the tariffs themselves would make markets nervous and could harm growth.
“The inflationary impact is not a big deal, quantitatively,” Rogoff said. “More worrisome is that it’s chaotic, it hurts these animal spirits that he’s benefiting from. It actually leads to slower growth.”
Trump has promised to “reignite explosive economic growth” over his four years in office, adding in his inauguration speech that tariffs could lead to “massive amounts of money” pouring into the US.
Wall Street is bullish that Trump’s push to loosen regulation for businesses could boost growth. But any pro-growth policies from Trump will likely still be outweighed by “counterproductive” policies, Rogoff said, speaking in a separate interview with Bloomberg at the event.
Interest rates are also much higher than they were when Trump first took office in 2017, which is a wrinkle in any plans to juice the economy beyond already fairly robust levels of growth.
“Every campaign promise practically is something counterproductive — I mean, you can go to the tariffs, social security being not taxed, and on and on and on,” Rogoff said. “He has a lot of constraints that he didn’t face the first time. So I don’t think you can expect quite the boom we got the last time,” he later added.
Other forecasters have also issued downbeat outlooks for what could happen during Trump’s presidency. Steve Hanke, another top economist, said the US could slip into a recession as soon as Trump’s first year in office.
Read the full article HERE.
Trump says Chinese President Xi Jinping ‘knows where I stand’ when it comes to tariffs
President Donald Trump announced he is planning a 10 percent tariff on Chinese imports on Feb. 1 over the country’s role in fentanyl trafficking.
“We’re talking about a tariff of 10% on China, based on the fact that they’re sending fentanyl to Mexico and Canada,” Trump told reporters at the White House on Tuesday. “Probably February 1st is the date we’re looking at.”
When asked about a conversation he had with Chinese President Xi Jinping ahead of his inauguration this week, Trump added that “We didn’t talk too much about tariffs other than he knows where I stand.”
During his campaign, Trump threatened tariffs as high as 60 percent on goods from China. He recently pledged on Truth Social to create an “External Revenue Service” to “collect our Tariffs, Duties, and all Revenue that come from Foreign sources.”
Trump and his allies have argued that such a plan would bolster American manufacturing while making it more difficult for adversaries like China to “export their way out of their current economic malaise,” as Treasury Secretary nominee Scott Bessent told senators last week.
However, Democrats and opponents argue the cost of the tariffs would just be passed on to American consumers.
“Not only would widespread tariffs drive up costs at home and likely send our economy into recession, but they would likely lead to significant retaliation, hurting American workers, farmers, and businesses,” Rep. Suzan DelBene, D-Wash., recently said in a statement.
At a press briefing Wednesday, Chinese foreign ministry spokesperson Mao Ning told reporters that “We always believe that there is no winner in a trade war or tariff war,” according to Reuters.
Trump also has said a 25 percent levy will be placed on all goods from Canada and Mexico by February.
In late November, Trump wrote on his Truth Social account that he would implement such tariffs on Jan. 20 as one of his first Executive Orders and that the tariffs “will remain in effect until such time as Drugs, in particular Fentanyl, and all Illegal Aliens stop this Invasion of our Country!”
Those promised tariffs haven’t gone into effect yet, but on Monday, Trump did sign an executive order titled “America First Trade Policy.”
“The Secretary of Commerce, in consultation with the Secretary of the Treasury and the United States Trade Representative, shall investigate the causes of our country’s large and persistent annual trade deficits in goods, as well as the economic and national security implications and risks resulting from such deficits, and recommend appropriate measures, such as a global supplemental tariff or other policies, to remedy such deficits,” the order says.
“The Secretary of the Treasury, in consultation with the Secretary of Commerce and the Secretary of Homeland Security, shall investigate the feasibility of establishing and recommend the best methods for designing, building, and implementing an External Revenue Service (ERS) to collect tariffs, duties, and other foreign trade-related revenues,” it adds.
Read the full article HERE.
Gold prices rose in Asian trading on Tuesday as the dollar weakened sharply overnight, while traders tried to assess U.S. President Donald Trump’s policies following his inauguration.
Spot Gold rose 0.3% to $2,727.39 per ounce, while Gold Futures expiring in February gained 0.4% to $2,743.57 an ounce by 01:28 ET (06:28 GMT).
Bullion rises due to ‘safe-haven’ shine amid uncertainty
Gold traders are bracing for increased volatility as Trump begins his second term, with his anticipated policy announcements expected to influence market dynamics.
The precious metal, traditionally viewed as a safe-haven asset, has maintained its price above a one-month peak.
Market sentiment is currently shaped by the interplay between potential U.S. policy shifts and the Federal Reserve’s monetary stance.
Trump has vowed to impose new trade tariffs on its neighboring countries, and China to bring down its trade deficit. This could provide renewed strength to the dollar, thereby affecting gold prices.
The US Dollar Index fell more than 1% overnight but rebounded later in Asia hours, rising 0.3%.
A weaker dollar typically drives gold prices higher because it makes the metal cheaper for buyers using other currencies.
Traders are closely monitoring Trump’s moves to assess their impact on gold’s trajectory.
Other precious metals were mixed on Tuesday. Platinum Futures were 0.4% lower at $958.80 an ounce, while Silver Futures rose 0.6% to $31.30 an ounce.
Copper remains under pressure as tariff concerns weigh
Among industrial metals, copper prices were subdued as a combination of anticipated U.S. tariffs, prospects of a stronger dollar, and investor caution after Trump’s inauguration, weighed on the red metal.
During periods of escalating tariffs and trade tensions, such as in mid-2018 and mid-2019, copper prices declined sharply as investors anticipated reduced demand from China, the world’s largest copper consumer.
Benchmark Copper Futures on the London Metal Exchange were largely muted at $9,255.50 a ton, while February Copper Futures fell 0.6% to $4.2910 a pound.
Read the full article HERE.
Key Points:
- Analysts forecast XAU/USD could climb to $2,950 in 2025 as geopolitical risks under Trump increase safe-haven demand.
- Inflation, fiscal deficit concerns, and geopolitical risks could drive a bullish XAU/USD market during Trump’s administration.
- Tariffs may spur inflation, boosting XAU/USD.
- Weak dollar under Trump could fuel XAU/USD strength.
- Fed rate hikes could limit gold’s momentum, but inflationary pressure under Trump may support XAU/USD growth.
How Could Trump’s Tariff Policies Impact Gold Prices?
Donald Trump’s renewed focus on tariffs could have a significant influence on gold prices. By raising the cost of imports to support domestic industries, tariffs often lead to higher consumer prices. This effect could stoke inflation, which traditionally boosts gold’s appeal as a hedge.
Analysts from Goldman Sachs suggest that inflationary pressure from tariffs could push investors to allocate more funds to gold, driving its demand higher. If inflation accelerates in 2025, gold prices could gain substantial upward momentum.
Will Tax Cuts and Deregulation Weaken the Dollar?
Trump’s proposed tax cuts and deregulation are designed to stimulate economic activity. However, these measures could expand the federal deficit, potentially weakening the U.S. dollar.
When the dollar depreciates, gold tends to benefit as it becomes cheaper for investors using other currencies. Many market participants recall similar trends during Trump’s first term, when tax policies initially sparked optimism but later raised concerns about fiscal sustainability.
Experts at Morgan Stanley suggest the dollar’s performance could be a key driver of gold prices under this administration.
Could Geopolitical Risks Drive Gold Demand?
Trump’s assertive approach to foreign policy has historically heightened global uncertainty. As a result, gold’s role as a safe-haven asset may gain prominence.
Investors seeking stability during unpredictable times often turn to gold, and the potential for diplomatic tensions could increase demand. Analysts at J.P. Morgan forecast gold could average $2,950 per ounce in 2025, with geopolitical risks being a significant contributing factor.
Inflation, Fed Policy, and Powell’s Influence
Trump’s policies could create inflationary pressures, but how these intersect with the Federal Reserve’s monetary stance remains to be seen. Fed Chair Jerome Powell has indicated a commitment to taming inflation through higher interest rates if needed, which could strengthen the dollar and weigh on gold prices.
Historically, Trump has been critical of Powell, accusing him of being overly hawkish on rates. Renewed clashes between the White House and the Fed could introduce volatility to markets, further influencing gold demand.
If the Fed opts for a tighter policy stance, it may counteract gold’s bullish momentum. Conversely, if the Fed pivots or pauses rate hikes, inflationary concerns could dominate, providing additional tailwinds for gold.
Gold Prices Forecast After Trump Takes Office
With inflation risks, a potentially weaker dollar, and geopolitical concerns on the horizon, the outlook for gold appears bullish under Trump’s policy agenda.
However, traders should closely watch the interplay between inflation trends and Federal Reserve actions. Powell’s influence on interest rates and the dollar will likely remain key factors in determining gold’s direction during Trump’s administration.
Read the full article HERE.
Stephen Miran, nominated to advise Trump, has suggested high tariffs could be the price allies pay for U.S.’s defense umbrella

To serve as an economic adviser to Donald Trump, it helps to share his belief that tariffs make the U.S. richer. Not many economists meet that criterion.
Stephen Miran has made just that case. Miran, the president-elect’s choice to chair his Council of Economic Advisers, has written that the U.S. could be better off with average tariffs of around 20% and as high as 50%, compared with the current 2%.
Miran’s views are worth studying, and not just because he’s going to advise Trump. He has described tariffs as a tool, and international intervention to weaken the dollar as another, that could address a longstanding global tension: the U.S.’s economic and military support for other countries have contributed to an overvalued dollar, wide trade deficit and hollowed-out industrial base.
“Sweeping tariffs and a shift away from strong dollar policy can have some of the broadest ramifications of any policies in decades, fundamentally reshaping the global trade and financial systems,” Miran wrote in a November report for Hudson Bay Capital, where he is senior strategist.
Miran wrote the report “A User’s Guide to Restructuring the Global Trading System” before he was named in late December as Trump’s choice to chair the CEA, the White House’s in-house economic think tank.
The report, Miran wrote, reflected his views, not Trump’s, and is intended not as policy advocacy but to “understand the range of possible policies that might be implemented.”
Miran, 41, earned his Ph.D. in economics from Harvard University in 2010 and he has since worked in financial markets and is a fellow at the conservative Manhattan Institute.
While novel, his arguments—including for tariffs—are grounded in orthodox economics. Miran is not a contrarian who assumes “all academics must be wrong,” said David Cutler, a Harvard economist who served in the Clinton administration and was one of Miran’s Ph.D. advisers. He’s “guided by the theory and evidence.”
That doesn’t mean his proposals would work. His report acknowledges a high risk that they won’t: “There is a path by which these policies can be implemented without material adverse consequences, but it is narrow.”
Economists agree that trade enables a country to both consume and produce more, and tariffs leave it worse off. Yet in the decades after Adam Smith made the definitive case for free trade in 1776, economists identified conditions under which a country might be better off imposing a tariff.
Suppose an importer is a monopsonist—a dominant enough buyer to influence the price it pays (just as a monopolist influences the price at which it sells). It could impose a $10 tariff on an imported widget, and its price, instead of rising $10, would stay the same because the exporter lowered its own price by $10 to avoid losing market share.
So consumers are unscathed. Even if they pay a bit more, that might be more than offset by tariff revenue. The rate that maximizes this net benefit is called the “optimal tariff.” Miran cites research by Arnaud Costinot of the Massachusetts Institute of Technology and Andrés Rodríguez-Clare of the University of California, Berkeley, that a tariff of around 20% is optimal, and up to 50% could still leave the U.S. better off.
This represents an argument for higher tariffs as a goal in and of themselves, in contrast to some Trump allies’ defense of tariffs as a negotiating tactic.
An optimal tariff policy is explicitly “beggar-thy-neighbor”: one country benefits only by hurting another. Since World War II, as the world pursued reciprocal tariff reductions, “it’s hard to find real life examples of countries motivated to pursue it in a systematic, and deliberate, way,” said Doug Irwin, a trade historian at Dartmouth College.
Optimal tariff theory has some real-world drawbacks. It doesn’t seem borne out by Trump’s tariffs on China. In an interview, Costinot noted that studies found the tariffs were mostly passed through to American importers. (Miran’s report disputed those studies.)
If other countries retaliate, as China, the European Union, Mexico and Canada did in 2018, the tariff is no longer optimal: Both sides lose. “Retaliatory tariffs by other nations can nullify the welfare benefits of tariffs for the U.S.,” Miran acknowledged.
To deter retaliation, he wrote that the Trump administration could “declare that it views joint defense obligations and the American defense umbrella as less binding or reliable for nations which implement retaliatory tariffs.” In other words, the U.S. might not defend Japan, South Korea or a fellow NATO member that retaliated.
Another problem: Tariffs only leave the U.S. better off if import prices barely rise. But in that case, consumers have no incentive to switch from imported to domestic goods, which nullifies Trump’s aim of boosting American manufacturing.
Yet another caveat is that tariffs might not reduce the trade deficit because the dollar rises in response, which makes imports cheaper and exports less competitive.
As an alternative to tariffs, Miran said the U.S. could weaken the dollar through a “Mar-a-Lago Accord,” modeled on the 1985 Plaza Accord in which the U.S. and its allies jointly acted to drive down the dollar. “After a series of punitive tariffs, trading partners such as Europe and China become more receptive to some manner of currency accord in exchange for a reduction of tariffs,” he wrote. Or, the U.S. could impose a user fee on buyers of Treasury debt.
If this triggers selling of long-term bonds, the Federal Reserve might have to buy them to limit upward pressure on long-term interest rates, Miran wrote. The Fed is more likely to cooperate with the Treasury on currency and bond interventions in return for independence on monetary policy, he wrote. (Trump has demanded more say on monetary policy. Miran has elsewhere proposed the president and state governors have more control over the Fed’s governance.)
A major question is whether a threat to withhold the defense umbrella from countries that don’t cooperate would be effective. The U.S. has no defense alliance with Mexico, Vietnam or China which account for half the U.S. trade deficit.
On Tuesday, Trump declined to rule out military force to pry Greenland from Denmark, and that he would use “economic force” to annex Canada. Both are fellow NATO members. Allies may conclude from Trump’s repeated threats against them that the U.S. defense guarantee no longer exists. Russia and China may draw the same conclusion, and seize the opportunity to increase aggression against their neighbors.
Miran himself dryly acknowledged “potentially volatile…consequences.”
Read the full article HERE.
- Gold hits its highest level since Dec. 12
- Treasury yields pare gains after US data
- US weekly jobless claims increase more than expected
Gold prices rose to a more-than-one-month high on Thursday after the latest U.S. economic data pressured the Treasury yields further, following a soft core inflation reading this week that increased bets for a more dovish Federal Reserve policy.
Spot gold gained 0.8% to $2,718.00 per ounce as of 9:55 a.m. ET (1455 GMT), hitting its highest since Dec. 12. U.S. gold futures rose 1.1% to $2,748.60.
Initial claims for state unemployment benefits rose to a seasonally adjusted 217,000 for the week ended Jan. 11, the Labor Department said on Thursday. A Reuters poll had forecast 210,000 claims.
“The initial jobless claims were more than expected, so that signals some weakening in the labour market,” said Alex Ebkarian, chief operating officer at Allegiance Gold.
“We also saw the U.S. Treasury yields dropping, so we’re seeing the attractiveness of gold re-invigorating.”
U.S. Treasury yields pared gains and were trading near a one-week low after retail sales, jobless claims and import prices data.
Gold prices extended gains on Wednesday after data showed core U.S. inflation increased 0.2% in December after rising 0.3% for four straight months, also giving hopes for easing monetary policy.
Markets now expect the Fed to deliver 37 basis points (bps) worth of rate cuts by year-end, compared with about 31 bps before the inflation data.
Gold is seen as a hedge against inflation, but higher interest rates tarnish non-yielding bullion’s allure.
“Gold should find itself in a supportive environment, so long as market participants can hold on to expectations for Fed rate cuts in 2025,” said Exinity Group chief market analyst Han Tan.
Elsewhere, Israel airstrikes killed at least 77 people in Gaza, hours after a ceasefire deal was announced to bring an end to 15 months of war.
Spot silver rose 0.3% to $30.74 per ounce and platinum firmed 0.2% to $940.00, while palladium fell 1.9% to $943.0.
Read the full article HERE.
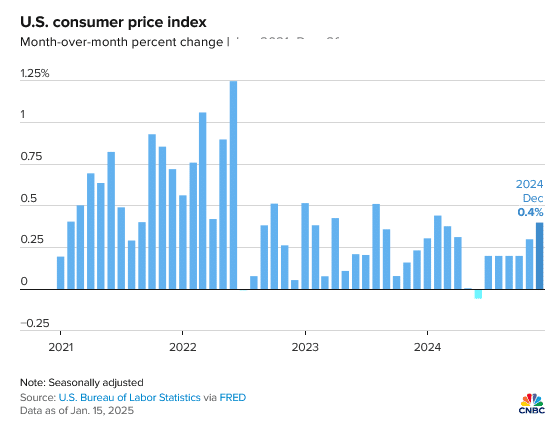
- The consumer price index increased a seasonally adjusted 0.4% on the month, putting the 12-month inflation rate at 2.9%. The annual number was in line with forecasts.
- Core CPI annual rate was 3.2%, a notch down from the month before and slightly better than the 3.3% outlook.
- Shelter prices, which comprise about one-third of the CPI weighting, rose by 0.3% but were up 4.6% from a year ago, the smallest one-year gain since January 2022.
- Stock market futures surged following the release while Treasury yields tumbled.
Prices that consumers pay for a variety of goods and services rose again in December but closed out 2024 with some mildly better news on inflation, particularly on housing.
The consumer price index increased a seasonally adjusted 0.4% on the month, putting the 12-month inflation rate at 2.9%, the Bureau of Labor Statistics reported Wednesday. Economists surveyed by Dow Jones had been looking for respective readings of 0.3% and 2.9%.
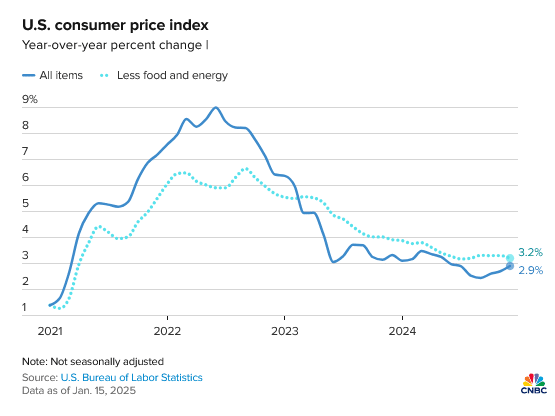
However, excluding food and energy, the core CPI annual rate was 3.2%, a notch down from the month before and slightly better than the 3.3% forecast. The core measure rose 0.2% on a monthly basis, also 0.1 percentage point less than expected.
Much of the move higher in the CPI came from a 2.6% gain in energy prices for the month, pushed higher by a 4.4% surge in gasoline. That was responsible for about 40% of the index’s gain, according to the BLS. Food prices also rose, up 0.3% for the month.
On an annual basis, food climbed 2.5% in 2024 while energy nudged down by 0.5%.
Shelter prices, which comprise about one-third of the CPI weighting, rose by 0.3% but were up 4.6% from a year ago, the smallest one-year gain since January 2022.
Stock market futures surged following the release while Treasury yields tumbled.
Though the numbers compared favorably to forecasts, they still show that the Federal Reserve has work to do to reach its 2% inflation target. Headline inflation moved down from its 3.3% rate in 2023, while core was 3.9% a year ago.
“Today’s CPI may help the Fed feel a little more dovish. It won’t change expectations for a pause later this month, but it should curb some of the talk about the Fed potentially raising rates,” said Ellen Zentner, chief economic strategist at Morgan Stanley Wealth Management. “And judging by the market’s initial response, investors appeared to feel a sense of relief after a few months of stickier inflation readings.”
The inflation readings this week – the BLS released its produce price index Tuesday – are expected to keep the Fed on hold when it convenes its policy meeting later this month.
While the market cheered the CPI release, the news was less positive for workers: Inflation-adjusted hourly earnings for the month fell by 0.2%, putting the year-over-year gain at just 1%, the BLS said in a separate release.
Details in the inflation report otherwise were mixed.
Used car and truck prices jumped 1.2% while new vehicle prices also moved higher by 0.5%. Transportation services surged 0.5% and were up 7.3% year over year, while egg prices jumped 3.2%, taking the annual gain to 36.8%. Auto insurance rose 0.4% and was up 11.3% annually.
“The inflation rate is currently grappling with a ‘last mile’ problem, where progress in reducing price pressures has slowed,” said Sung Won Sohn, a professor at Loyola Marymount University and chief economist at SS Economics. “Key drivers of inflation, including gas, food, vehicles, and shelter, remain persistent challenges. However, there are signs of hope that long-term inflationary pressures may continue to ease, aided by moderating trends in critical sectors such as shelter and labor costs.”
The report comes with markets skittish over the state of inflation and the Fed’s potential response. Tariffs and mass deportations that President-elect Donald Trump has promised have increased concerns over inflation.
Job growth in December was much stronger than economists had expected, with the gain of 256,000 further raising concerns that the Fed could stay on hold for an extended period and even contemplate interest rate increases should inflation prove stickier than expected.
The December CPI report, coupled with a relatively soft reading Tuesday on wholesale prices, show that while inflation is not cooling dramatically, it also isn’t showing signs of reaccelerating.
A separate report Wednesday from the New York Fed showed manufacturing activity softening but prices paid and received rising substantially.
Futures pricing continued to imply a near-certainty that the Fed would stay on hold at its Jan. 28-29 meeting but titled more favorably towards two rate cuts through the year, assuming quarter percentage point increments, according to CME Group figures. Markets expect the next cut likely will happen in May or June.
The Fed uses the Commerce Department’s personal consumption expenditures price index as its primary forecasting measure for inflation. However, the CPI and PPI measures figure into that calculation.
The two readings likely mean that core PCE will rise just 0.2% in December, keeping the annual rate at 2.8%, according to Samuel Tombs, chief U.S. economist at Pantheon Macroeconomics.
Read the full article HERE.