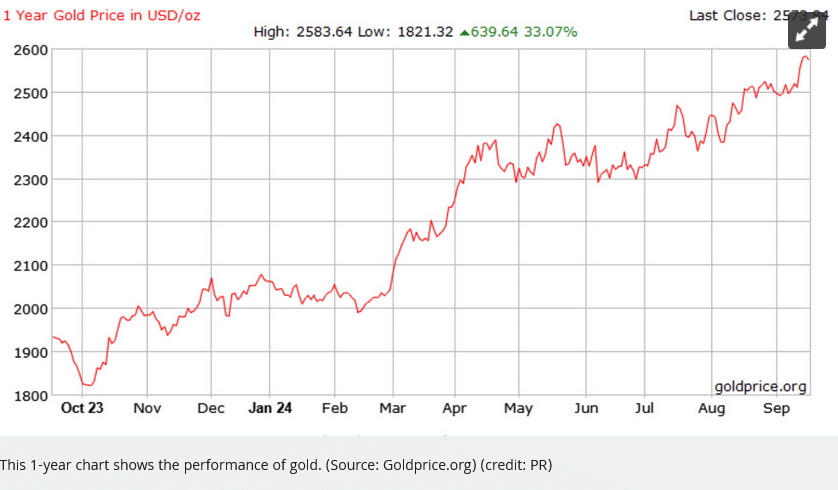
Gold has surged despite macroeconomic headwinds, primarily due to central bank purchasing and geopolitical tensions. Could the rally see another gear after lower interest rates and a weaker dollar?
John Reade of the World Gold Council has seen gold rally to record highs of about $2,575 an ounce despite a strengthening dollar and rising interest rates in Europe and the U.S.
Now, he’s looking to the yellow metal to see how it performs when those headwinds are removed.
“Gold has been able to ignore some of the classic macro drivers,” he told Investing News Network. “But that may be changing now. … I think it’s going to be Western macroeconomic factors that probably take the lead in determining gold’s direction for the balance of this year and into 2025.
“Gold typically performs pretty well when rates are cut, and if those rate cuts lead to weakness in the U.S. dollar, which they certainly might, that could be a double tailwind helping the metal from here.”
Global debt levels continue to rise
Global debt recently hit an all-time high after three consecutive quarterly reductions, which should turn investors to gold, according to Jupiter Asian Income manager Jason Pidcock.
“Fiscal policy globally is very loose, and that is a concern,” he told Portfolio Adviser. “Budget deficits — even when economies have supposedly been strong — have been way too high, and that’s why we’re invested in gold mines.”
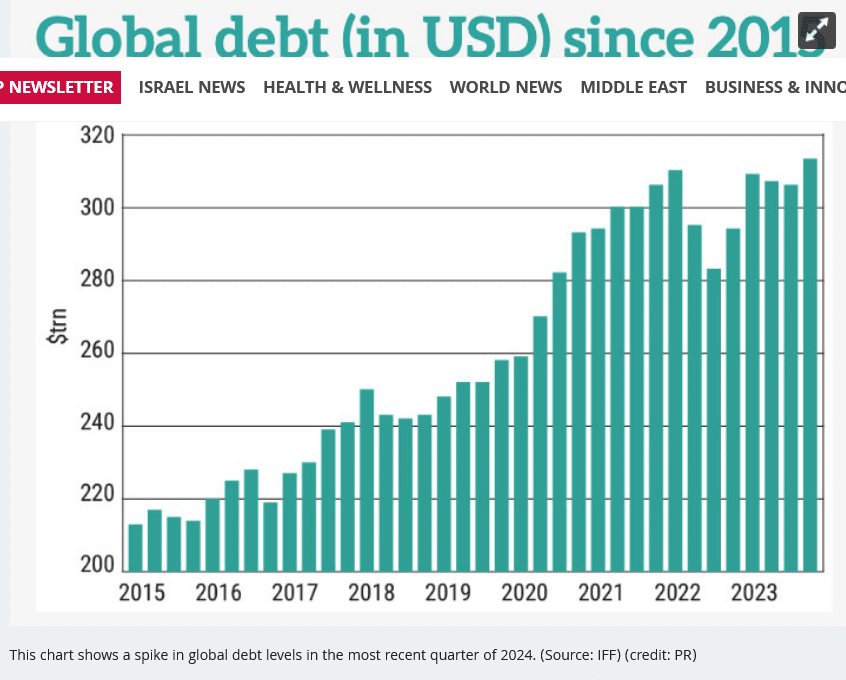
Pidcock said Jupiter Asian Income is speculating a reduction in value among fiat currencies, which should lead to a rise in commodities prices.
“Everyone should have some exposure to gold, whether it’s as an insurance policy or just sensible diversification,” he said.
See full article HERE
Happy Fed day, in what will be a momentous decision not just for the fact that it will herald the beginning of an interest rate-cutting cycle but for the uncertainty over the magnitude of the reduction.
The last time the interest rate for a Fed decision was set more than 10 basis points away from market expectations was March 3, 2020 — the emergency cut at the beginning of the COVID pandemic, points out Michael Brown, senior research strategist at Pepperstone. That gives the interest-rate cycle a symmetry — uncertainty on the way up, and uncertainty on the way down.
But it may be a puzzle as to why the Fed is cutting rates at all when the economy is far from recession — the Atlanta Fed’s GDPNow estimate of third-quarter growth is a healthy 3% — and inflation is still above target.
David Kotok, the chief investment officer of Cumberland Advisors who hosts an annual summer gathering in Maine of investors and other financial market participants, points to a warning from an employment measure that doesn’t officially exist. It’s called U-7, invented by David Blanchflower, the Dartmouth labor economist who served on the Bank of England’s monetary policy committee.
U-7 is actually not hard to compile — it’s a simple calculation involving two measures of underemployment that the Labor Department produces each month. It yields the number of part-time workers who want full-time jobs as a percentage of the workforce.
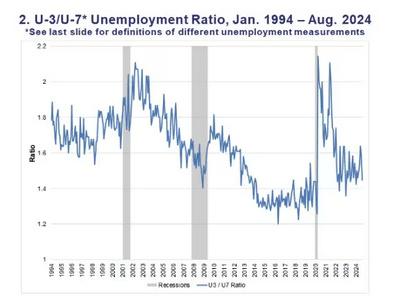
Kotok says the idea behind U-7 is that it isolates the most fragile element of the workforce. He says the way to use the number is to compare it with the main unemployment rate, which the Labor Department calls U-3. When the U-3 rises faster than the U-7, that’s a recession warning.
Blanchflower himself in a paper he co-authored said the U-7 segment also is key to understanding wage pressure. The idea is that it’s an indicator of the weak bargaining power of the full-timers. When there’s a bigger pool of underemployed, that naturally leads to less bargaining power for the fully employed.
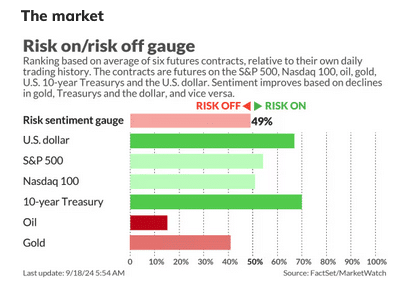
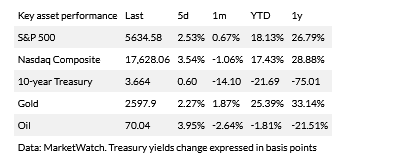
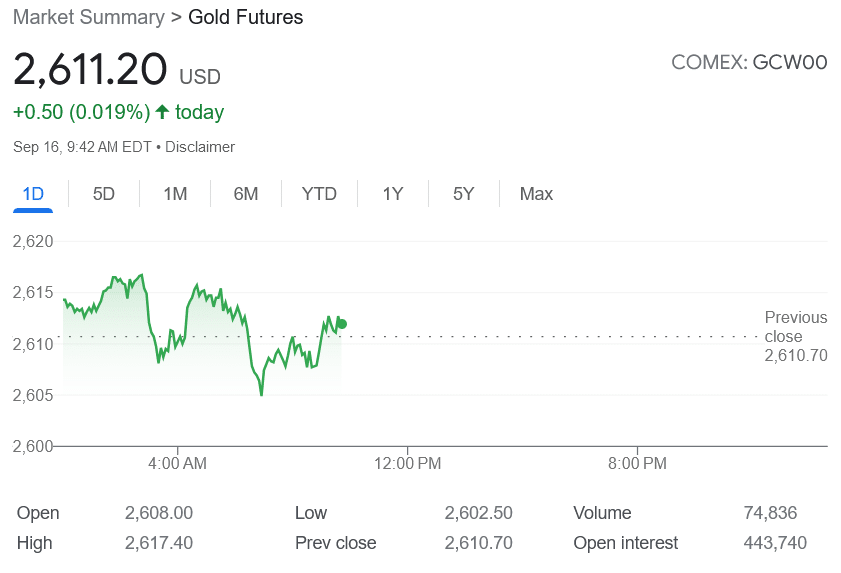
U.S. stock index futures ES00-0.09%, NQ00-0.06% edged higher early Wednesday, following the fourth highest close on record for the S&P 500 SPX-0.08% . Oil CL00-2.19% was trading below $70 per barrel. Gold GC000.16% was hovering around $2,600 an ounce.
The buzz
The Fed decision is due at 2 p.m. Eastern, with the market leaning toward a half percentage point, rather than 25 basis point, reduction. Jerome Powell’s press conference starts 30 minutes later.
Mortgage activity, and in particular refis, soared heading into the Fed decision, according to Mortgage Bankers Association data. Housing starts also rose, topping forecasts.
See the full article HERE.
By Andrew Addison
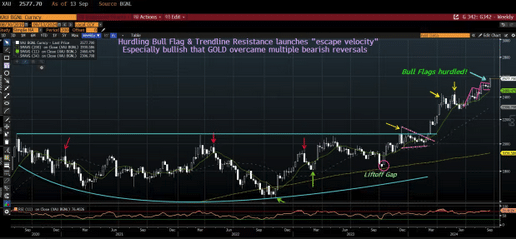
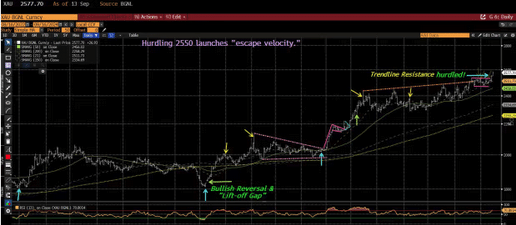
My work turned bullish long-term on gold GC00 -0.78% almost two years ago when the precious metal closed above $1680 an ounce in November 2022. Its most recent cyclical advance began with its liftoff gap last October at $1845. Then, in March, gold said goodbye to 13 years of resistance in the $2100 area when it broke out decisively. And now with last week’s record close at $2610, gold is beginning to advance with “escape velocity,” which projects substantially higher prices.
Let’s check the charts to see why.
The daily chart (above) illustrates the resistance trendline that had repelled gold starting in April. Despite many false starts and bearish reversals (yellow arrows), gold consolidated for a month at resistance before breaking out last Thursday.
Next, the weekly chart (above) shows that after false starts (yellow arrow), gold formed two “bull flags” (pink). Quick advances were followed by sideways price action and sharp advances to new highs. With a decisive hurdling of final resistance, gold launched escape velocity.
On the monthly chart, you can see the gigantic 13-year base. From 2020 to 2023, gold formed a series of high-level consolidations. Each high-level consolidation was higher and shorter than the previous one—indicating weakening selling pressure on each probe to the top of the base.
With last month’s breakout, gold overcame final resistance to begin “escape velocity” that my work projects to $3000-plus. Consider all pullbacks as opportunities to buy or add to positions.
See full article HERE.
The investment bank’s models show the average calendar-year return for the S&P 500 could shrink to 5.7%, roughly half the level since World War II.
Millennials and Generation Z might not enjoy the robust returns from U.S. stocks that helped swell the retirement accounts of their parents and grandparents, according to a team of equity analysts at J.P. Morgan Securities.
Over the next decade, the average calendar-year return of the S&P 500
SPX-0.14% could shrink to 5.7%, based on the models maintained by a team of strategists at JPMorgan focused on long-term market performance. That is roughly half the pace of returns seen since the end of World War II.
The basis for their argument was mostly mathematical. Current stock-market valuations are high relative to history, largely due to the performance of a handful of megacap stocks like the members of the Magnificent Seven.
Reams of historical data suggest that, over the long term, valuations should return to the mean, which should translate to lower stock-market returns in the years ahead.
With a current trailing price-to-earnings ratio of 23.7 times, the S&P 500 is about 25% more expensive relative to its 35-year average of 19 times. Robert Shiller’s Cyclically Adjusted PE ratio, another valuation metric used by the team, showed stocks are even more richly valued currently.
But as is often the case in markets, models rarely tell the whole story. So the JPM team theorized some fundamental factors that could weigh on stock-market returns going forward.
The most obvious, according to them, is the pace at which the U.S. population — and indeed, much of the global population — is aging. Older investors tend to shirk stocks in favor of more conservative investments, like bonds.
This could help to weigh on the average household allocation to stocks as more baby boomers and older members of Generation X reach retirement age. Currently, that allocation is at record highs, as the chart below shows.
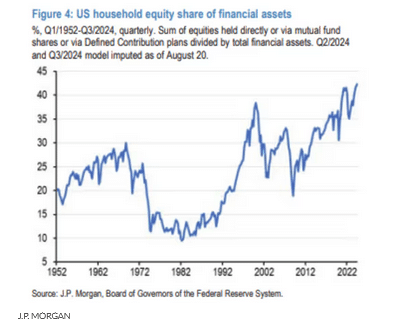
“Multiples could come down because aging induces the growing cohort of elderly baby boomers to lower their equity allocations, currently at record highs, in line with their shrinking investment horizons,” said strategist Jan Loeys and Alexander Wise said in a report.
But there are other issues out there that could weigh on stock-market returns ahead. The team also questioned whether corporations could can continue to expand after reaching record highs during the COVID-19 pandemic.
Globalization and growing market concentration had helped profits grow more quickly than the economy since the early 1990s, as did generous corporate tax cuts. But tax rates could rise as the U.S. scrambles to reduce its budget deficits.
And although there is not a ton of evidence yet that taking on the biggest companies could yield gains for politicians, the team noted that antitrust actions by the U.S. government have picked up over the past few years.
If they progress, antitrust efforts by the government could help shake the dominance of some of the largest Big Tech firms, potentially dimming their already exorbitant (relative to recent history) valuations.
Increasing U.S. political instability and dedollarization could also emerge to diminish equity returns over the long run, the strategists said. Although, so far, neither has had much of a discernible impact on markets.
In fact, U.S. markets have proven remarkably resilient to rising government budget deficits, the team said. But that could change over the next five or 10 years, as foreign investors become less enthusiastic about dollar-denominated assets.
The team concluded their analysis with a caveat: their observations are only useful over the long run. They shouldn’t be applied with the purpose of trying to time the market.
“Valuations…are great at informing us about returns over long holding periods but are quite poor at giving us a clean direction, up or down, over the near term,” the team said.
The S&P 500, Nasdaq Composite COMP0.04% and Dow Jones Industrial Average DJIA-0.15% tallied their worst calendar-year performance since 2008 in 2022, but since then, all three have made a remarkable comeback.
The S&P 500 rose by more than 24% last year, and is up more than 18.5% so far in 2024, according to FactSet data. The index was on the cusp of a fresh record closing high on Tuesday as traders awaited the latest interest-rate decision from the Federal Reserve. And the Dow was poised for another record close of its own.
The Nasdaq was also trading higher on Tuesday, but remained well below its July record high.
Read the full article HERE.
As we head into 2025, the gold market is witnessing a remarkable sequence of ‘events.’
There is no gold bull market without participation of gold miners.
Admittedly, gold miners have been lagging, tremendously in fact. But that’s changing ‘as we speak’ because gold miners are now staging epic secular breakouts.
In this article, we repeat the fundamental drivers underpinning this gold bull market. We also look at gold miners which are coming to life and will amplify the gold bull market.
Dominant Gold Price Drivers
Rising inflation expectations
Inflation expectations have proven to be a dominant market dynamic driving gold prices higher in this new gold bull market.
As inflation is stabilizing, globally, inflation expectations are on a steady path higher. Investors are increasingly turning to gold as a hedge against normalizing inflation.
Essentially, what happened in 2022 is that aggressive disinflationary policies introduced by policy makers pushed the real inflation rate lower. This, in turn, affected the gold price.
Historical data reveals that gold performs exceptionally well when inflation expectations are on the rise, as explained in great detail in Gold Price Drivers Remain Very Bullish Ahead Of 2025.
This trend is particularly relevant today, as inflationary pressures are pushing gold to new levels. The current economic environment, characterized by dominant dynamics around inflation and geopolitical tensions, is setting the stage for a continued rise in gold prices.
As we approach 2025, the rise in inflation expectations is expected to maintain momentum. This trend highlights the strength of gold as an investment asset, emphasizing its role as a key asset for smart and diversified investors.
Central bank purchasing: A supportive yet secondary dynamic
While central bank purchases of gold have certainly contributed to the bullish trend, they are secondary to the primary driver of rising inflation expectations. Central banks have been actively increasing their gold reserves, providing a supportive backdrop for gold prices.
Recent data from July 2024 indicates a substantial increase in central bank gold purchases, reaching 37 tons. This represents a notable rise in demand and helps support gold prices. However, it is important to recognize that the main catalyst for gold’s current bullish trend remains the growing concerns about inflation.
Central bank buying is an important component of the overall gold market dynamics. Primary and secondary price influencers for price of gold are nicely explained in this well researched gold price prediction.
Gold Miners: From Lagging to Leading
Gold mining stocks have faced a challenging period over the past 18 months. If anything, they have been lagging significantly behind the performance of bullion prices. This underperformance has been a divergence from the strong gains in gold itself.
However, the tide is turning for gold miners. Moreover, it has happening NOW.
One key factor driving the recent turnaround in gold mining stocks is the decline in crude oil prices. Lower oil prices reduce operational costs for mining companies, which is a significant advantage in an industry where energy expenses are a major component of overall costs.
Additionally, the surge in bullion prices is providing a strong incentive for mining companies to push their production up, affecting their revenue and profit margins.
These positive changes in market conditions are creating a perfect storm for gold miners, setting the stage for a potential breakout.
What makes this breakout so exceptional is that it’s occurring on a secular timeframe, marking a significant shift in the long-term trend. This is a major milestone in the gold mining sector. Surprisingly, this pivotal development has largely gone unnoticed by mainstream financial media. However, JPost.com is spotlighting this decisive evolution and is eager to share this important news with its readers.
Gold Miners’ secular breakouts happening now
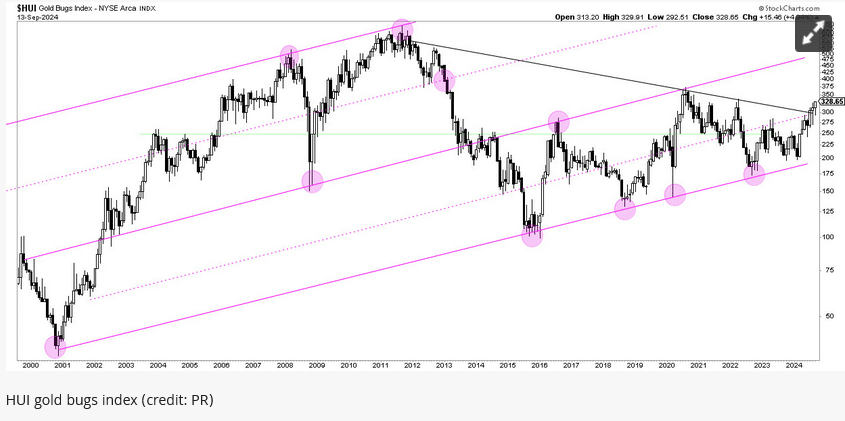
The HUI Gold Bug Index, a leading benchmark for gold mining stocks, is showing a dramatic bullish breakout.
This chart breakout is particularly noteworthy given the index’s previous period of underperformance.
The recent uptrend suggests that gold mining stocks are set for a significant recovery and could experience substantial gains (in the quarters and years to come) for as long as gold prices continue to rise.
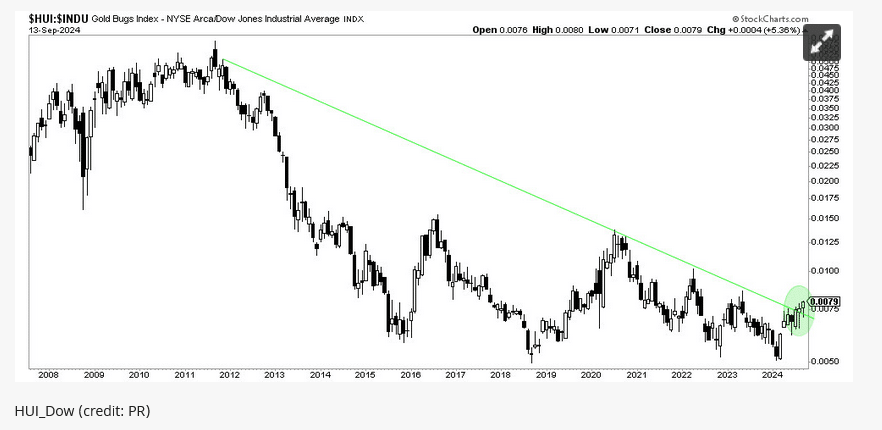
Furthermore, we look at a ratio chart. What’s interesting and insightful about ratio charts is that they express the value of a market segment expressed in another leading segment.
In particular, we like the HUI/Dow ratio a lot. It compares gold mining stocks to the defensive segment of the market represented by the Dow Jones Index.
As seen below, the HUI/Dow ratio has a chart pattern that exhibits a breakout out from a 12-year downtrend. This indicates that gold miners are gaining relative strength and suggests a promising outlook for the sector.
Opportunities and Considerations
The bullish development in the gold mining space represents a compelling investment opportunity. With gold prices driven by rising inflation expectations and favorable market conditions, gold mining stocks are likely to see considerable upside.
More importantly, gold miners are likely to fuel the gold bull market by improving even more bullish sentiment.
However, it is essential to remain mindful of potential risks. Gold miners are traditionally very volatile, and individual stocks come with individual risks. For investors seeking some safety, it is safe to consider either the leading gold mining ETFs and/or the large cap gold miners.
Conclusion
The gold market is entering a new phase as we head into 2025. This environment which is very favorable for gold is now having an impact on gold miners. They are finally emerging from a period of underperformance.
With favorable conditions, including high bullion prices and declining crude oil costs, gold mining stocks are set for a rebalancing act.
Read full article HERE.
Gold prices charged to a record high on Monday as a weaker dollar and the prospects of aggressive U.S. monetary policy easing boosted non-yielding bullion’s appeal.
Spot gold was up 0.4% at $2,586.04 an ounce by 0914 GMT after touching a record peak of $2,589.59. U.S. gold futures edged up by 0.1% to $2,613.40.
The dollar index eased 0.4%, making gold more attractive to other currency holders.
This week’s key event is the Federal Reserve interest rate decision due on Wednesday. Trader expectations are for a 59% chance of a cut of 50 basis points.
The first U.S. rate cut is getting closer and will be followed by more, supporting gold, said UBS analyst Giovanni Staunovo.
“Any change to the Fed dot plot is likely to result in near-term volatility, but I believe we are still on the path of higher prices over the coming months,” he said.
Bullion becomes generally a more attractive investment in periods of lower interest rates and is considered a safe asset in times of turmoil.
Macroeconomic and geopolitical concerns, U.S. elections and a likely increase in equity market volatility also make a compelling case for increasing investment in gold, ANZ analysts said in a note.
“We expect gold prices to move towards $2,700 in the short term and reach a high of $2,900 by the end of 2025,” the note added.
The FBI said that Republican presidential candidate Donald Trump was the subject of a second assassination attempt on Sunday.
Spot silver gained 1% to $30.95 an ounce, hitting its highest in two months earlier in the session.
Platinum shed 0.2% to $993.70 and palladium was up 0.2% at $1,070.70.
Data from China over the weekend showed industrial output growth slowed to a five-month low in August while retail sales and new home prices weakened further.
See full article HERE.
- With the Federal Reserve holding benchmark rates at their highest in 23 years, the government has laid out $1.049 trillion on debt service, up 30% from the same period a year ago.
- The jump in debt service costs came as the U.S. budget deficit surged in August, edging closer to $2 trillion for the full year.
The U.S. government for the first time has spent more than $1 trillion this year on interest payments for its $35.3 trillion national debt, the Treasury Department reported Thursday.
With the Federal Reserve holding benchmark rates at their highest in 23 years, the government has laid out $1.049 trillion on debt service, up 30% from the same period a year ago and part of a projected $1.158 trillion in payments for the full year.
Subtracting the interest the government earns on its investments, net interest payments have totaled $843 billion, higher than any other category except Social Security and Medicare.
The jump in debt service costs came as the U.S. budget deficit surged in August, edging closer to $2 trillion for the full year.
With one month left in the federal government’s fiscal year, the August shortfall popped by $380 billion, a dramatic reversal from the $89 billion surplus for the same month a year prior that was due largely to accounting maneuvers involving student debt forgiveness.
That took the 2024 deficit to just shy of $1.9 trillion, or a 24% increase from the same point a year ago.
The Fed is widely expected to lower rates next week, but just by a quarter percentage point. However, in anticipation of additional moves in future months, Treasury yields have tumbled in recent weeks.
The benchmark 10-year note last yielded about 3.7%, down more than three-quarters of a percentage point since early July.
See full article HERE.
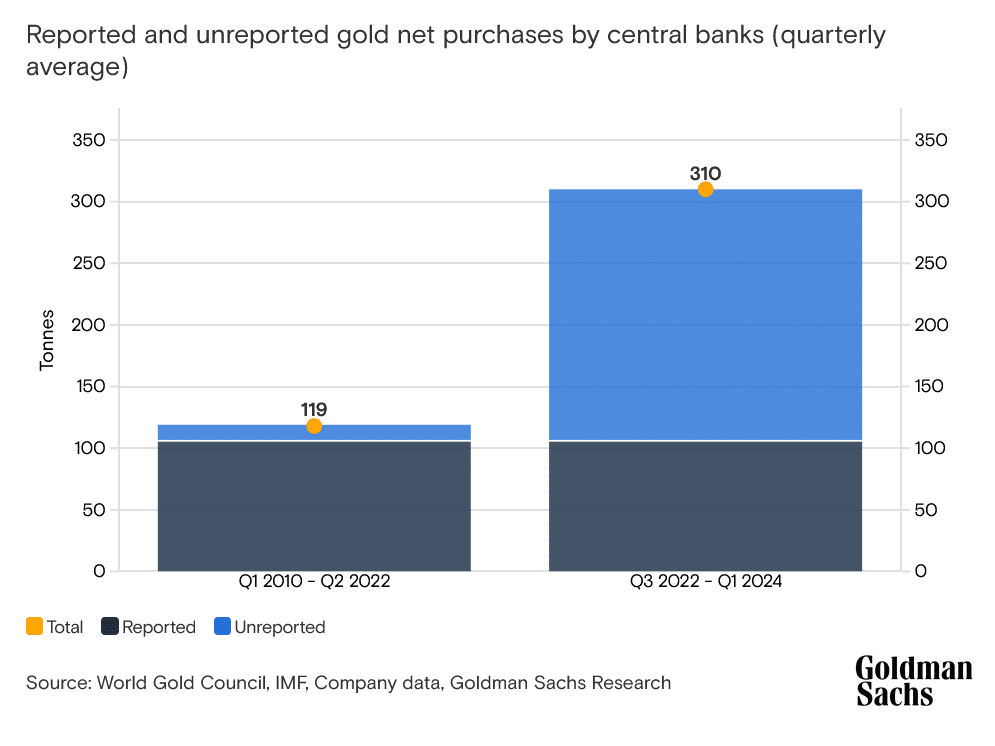
The price of gold has soared to new heights this year and is positioned to climb into early 2025, rising to new record highs, according to Goldman Sachs Research.
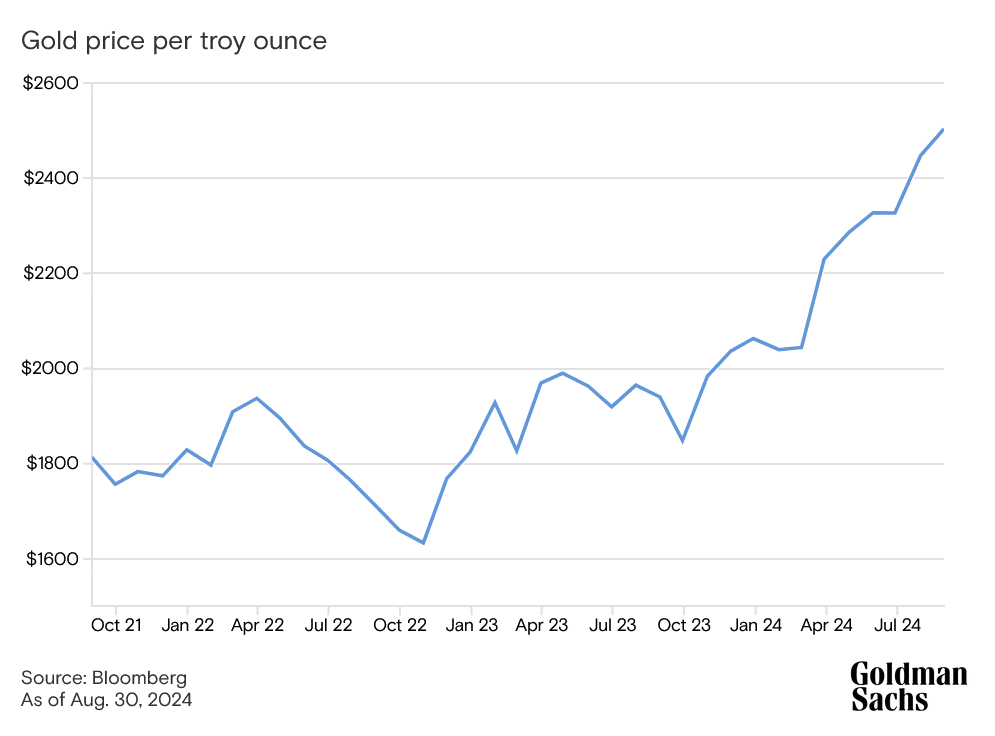
The precious metal has increased more than 20% this year, peaking at a record of more than $2,500 per troy ounce in August. Goldman Sachs Research forecasts the price will reach $2,700 by early next year, buoyed by interest rate cuts by the Federal Reserve and gold purchases by emerging market central banks. The metal could get an additional boost if the US imposes new financial sanctions or if concerns mount about the US debt burden.
Gold is our strategists’ preferred near-term long (the commodity they most expect to go up in the short term), and it’s also their preferred hedge against geopolitical and financial risks.
“In this softer cyclical environment, gold stands out as the commodity where we have the highest confidence in near-term upside,” Goldman Sachs Research strategists Samantha Dart and Lina Thomas write. They point to three factors in particular that could push gold prices higher:
- Central bank purchases: Since Russia’s invasion of Ukraine in 2022, central banks have been buying gold at a brisk pace — roughly triple the amount prior. Goldman Sachs Research expects the buying spree to persist amid concerns about US financial sanctions and the growing US sovereign debt burden.
- Fed rate cuts: Higher interest rates tend to make gold, which doesn’t offer a yield, less attractive to investors. Rate cuts by the Fed will likely bring Western investors back into the gold market after largely being absent during the metal’s sharp rally over the past two years.
- Potential geopolitical shocks: Gold offers significant value as a portfolio hedge against developments such as tariffs, Fed subordination risk (i.e., the risk that its independence may be undermined), and debt sustainability fears. Our researchers see roughly 15% upside in gold prices under a rise in financial sanctions equal to the rise seen since 2021, and similar gains if mounting debt concerns spur US government credit-default swap spreads (a measure of credit worthiness) to widen by 1 standard deviation (13 basis points).
Investors may need to be more selective when investing in other commodities, given softening in the global economy, according to Goldman Sachs Research. Our strategists make note of several challenges:
- Oil: China’s oil demand growth has slowed, in part because of structural road fuel switching (to electric vehicles, for example) and weakness in demand for petrochemicals. The supply of liquids from the US is also outpacing expectations. The team reduced its range for Brent prices by $5 to $70-$85 per barrel and its 2025 average Brent forecast to $76 (versus $82 previously).
- Industrial metals: Refined copper production has been elevated even as China’s copper consumption appears to have fallen in March (year-over-year) and in early summer. Goldman Sachs Research doesn’t expect the metal, used in everything from home building to circuit boards, to reach its $12,000/ton target until post-2025. They made similar and related downward revisions to aluminum forecasts.
- Natural gas: An upcoming wave of global liquefied natural gas (LNG) supply will hit the market from 2025 and grow significantly through most of the second half of the decade. “We have long argued that lower energy prices lie on the horizon,” our strategists write.
Commodities still deserve a place in investors’ portfolios as they provide hedges against supply disruptions, among other things, according to Goldman Sachs Research. Select industrial metals could also experience sharp rallies, driven by a combination of long supply cycles and increased demand related to energy security and decarbonization efforts. Overall, our strategists expect a total return of 5% for the GSCI Commodity Index in 2025, down from the 12% total return it expects for this year.
Read the full article HERE.
Gold has hit a new all-time high of $2,546, breaking previous resistance levels. With inflation, geopolitical tensions, and rising demand, gold’s surge signals its strength as a safe-haven asset.
Today, gold set a new record high, reaching $2,546 per ounce, surpassing its previous peak and marking a historic moment in the precious metals market. This new all-time high not only sets a fresh benchmark but also signals a significant breakout above previous resistance levels, which had kept gold trading within a narrower range for months. The breach of these resistance levels indicates a strong bullish momentum and opens the door for further potential gains. Amid global economic uncertainty, rising inflation, and geopolitical tensions, investors are flocking to gold as a safe haven, once again proving its resilience.
PPI Comes in Hot: How Economic Data is Feeding Gold’s Rise
Adding fuel to gold’s recent surge, the Producer Price Index (PPI) came in hotter than expected. The PPI rose by 0.2% month-over-month (MoM), compared to the expected 0.1%. The PPI Core, which excludes volatile food and energy prices, also outpaced expectations, increasing 0.3% MoM, versus the forecasted 0.2%.
Despite this economic data, which wasn’t overwhelmingly bullish for gold compared to other assets, the precious metal saw a notable rise. Stocks experienced a mild uptick, the dollar dipped slightly, silver strengthened, and copper remained stagnant. This suggests there was already pent-up buying pressure in gold waiting to be triggered, as the PPI numbers were enough to push it past the threshold. This indicates a weak lid on the market, making gold susceptible to further upward pressure.
Why Gold is Soaring
Several factors, in addition to the PPI report, have contributed to this unprecedented surge in gold prices:
1. Inflation Concerns
One of the primary drivers behind gold’s rally is the persistent fear of inflation. As central banks, including the U.S. Federal Reserve, struggle to balance interest rates with economic growth, the cost of goods and services continues to climb. Historically, gold has been seen as a hedge against inflation, making it an attractive option for investors looking to preserve their wealth.
2. Geopolitical Tensions
Geopolitical events have also played a key role in pushing gold prices to new heights. Ongoing conflicts, particularly in Eastern Europe, rising tensions in the Middle East, and economic sanctions against major global players have led to increased demand for safe-haven assets. Investors often turn to gold when there’s uncertainty on the international stage, as it tends to hold its value better than other assets in times of crisis.
3. De-Dollarization Efforts
Countries like China, Russia, and other BRICS nations are actively pursuing de-dollarization, seeking to reduce their reliance on the U.S. dollar. These nations have been stockpiling gold as a way to diversify their reserves and protect their economies from potential economic sanctions or shifts in the global financial order. As more nations follow this trend, the demand for gold has surged, pushing prices higher.
4. Interest Rate Decisions
The U.S. Federal Reserve’s recent comments on potential interest rate hikes have added fuel to gold’s rally. While higher interest rates typically lead to a stronger dollar and lower gold prices, the uncertainty around these rate hikes has caused volatility in the markets. Investors are flocking to gold as a stable asset in an otherwise unpredictable economic environment.
5. Supply Chain Disruptions
The mining and production of gold have also faced challenges due to disruptions in the global supply chain. The pandemic, coupled with environmental regulations and labor shortages, has slowed down gold extraction in several key regions. This has led to tighter supply, further driving up the price.
See Full Article HERE.
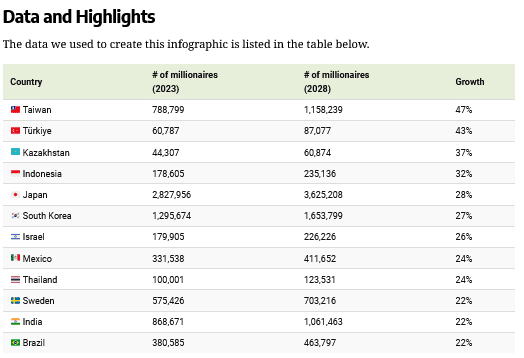
In this graphic, we ranked the top 12 countries by their rate of millionaire population growth, from 2023 to 2028 (forecasted).
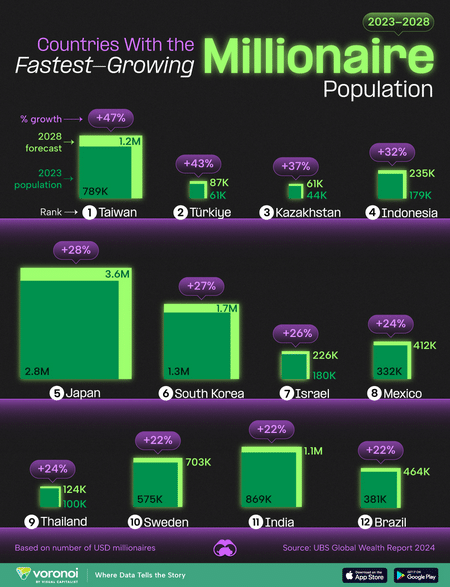
It reveals a variety of emerging markets (as well as a few developed economies) where the millionaire population is expected to increase by more than 20% over the next five years.
All figures come from the UBS Global Wealth Report 2024. Note that this analysis covers 56 countries, and is based on the number of U.S. dollar millionaires.
In this graphic, we ranked the top 12 countries by their rate of millionaire population growth, from 2023 to 2028 (forecasted).
It reveals a variety of emerging markets (as well as a few developed economies) where the millionaire population is expected to increase by more than 20% over the next five years.
All figures come from the UBS Global Wealth Report 2024. Note that this analysis covers 56 countries, and is based on the number of U.S. dollar millionaires.
Leading this ranking is Taiwan, which UBS expects will have over one million millionaires by 2028.
While organic growth is expected to account for some of its growth (primarily due to its powerful micro-chip industry), analysts expect the bulk of this increase will come from the immigration of wealthy foreigners.
In second place is Türkiye, with a projected 43% increase in millionaires by 2028. This could be due to various reasons, including the country’s growing tech sector.
According to the World Economic Forum, Turkey hosts six unicorn companies (startups valued at over $1 billion).
These are: Peak Games, Getir, Dream Games, Hepsiburada, Trendyol and Insider (an AI tech company not related to the media company Insider Inc.).
Which Countries Will Lose Millionaires?
While this UBS analysis doesn’t cover the entire world, their report does highlight two countries that will lose millionaires by 2028: The Netherlands (-4%) and the UK (-17%).
These projections line up with recent data from Henley & Partners, which estimated that nearly 10,000 millionaires would leave the UK in 2024.
Read the full story HERE.